The dependent variable (y) for a function.
Output
A teacher wants to see if there is a relationship between her students' test scores and the amount of time they study.
Identify the input and the output.
(input, output)
(amount of time a student studies, student's test score)
Create a mapping diagram that represents a one-to-one relation.
Would the mapping diagram represent a function?
{Mapping Diagrams will vary}.
Is a function.
Determine if the graph is linear. Explain. If it is linear, find the rate of change. 
Nonlinear.
Not a straight line.
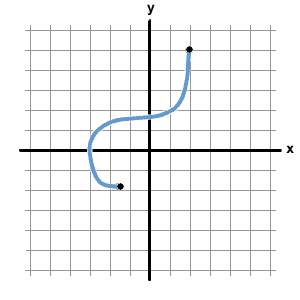
Determine if the graph is a function. Explain.
Is a function, because it passes the Vertical Line Test.
A type of relation where each input has exactly one output.
Function
A snow vendor collects data on the number of snow cones he sells per day and the daily temperatures.
Identify the input and the output.
(input, output)
(daily temperature, # of snow cones sold in a day)
Create a mapping diagram that represents a one-to-many relation.
Would the mapping diagram represent a function?
{Mapping Diagrams will vary}.
NOT a function.
Determine if the equation is linear. Explain. If it is linear, find the rate of change.
y = -8x - 2
Linear.
Equation is in slope-intercept form (y = mx + b).
m = -8
Determine if the graph is a function. Explain. 
Not a function, because it does not pass the Vertical Line Test.
A list of ordered pairs.
Relation
Identify the input and the output.
Then, write a function as an equation for the given information:
A limo service charges $90 for each hour.
(input, output)
(# of hours, total charged ($))
Function: f(x) = 90x
Given the list of ordered pairs, create a mapping diagram.
Determine what type of relation the mapping diagram shows.
Determine if the relation is a function.
{(-1,-1), (0,1), (1,3), (2,5)}
{Mapping Diagram on slide}.
One-to-one.
Is a function.
Determine if the table of ordered pairs is linear. Explain. If it is linear, find the rate of change.
| x | y |
| -3 | 4 |
| -5 | 5 |
| -9 | 7 |
Linear.
Rate of change is constant.
m = -1/2
Determine if the table is a function. Explain.
| x | y |
| 2 | 4 |
| 1 | 5 |
| 2 | 6 |
Not a function, because the x-value of 2 has two different outputs.
The method used to determine if a graph is a function.
Vertical Line Test
Identify the input and the output.
Then, write a function as an equation for the given information:
Carson charges $7 per hour for yard work.
(input, output)
(# of hours worked, total charged ($))
Function: f(x) = 7x
Given the list of ordered pairs, create a mapping diagram.
Determine what type of relation the mapping diagram shows.
Determine if the relation is a function.
{(5,-2), (-3,-2), (0,-2), (-2,-2)}
{Mapping Diagram on slide}.
Many-to-one.
Is a function.
Determine if the graph is linear. Explain. If it is linear, find the rate of change.
Linear.
Horizontal line. m = 0
Determine if the relation is a function. Explain.
{(6, 7), (8, 5), (2, 3), (4, 5), ( -2, 6)}
Is a function, each input has exactly one output (no x-values repeat).
The five ways that functions can be represented by.
GMOTE
Graphing
Mapping Diagrams
Ordered Pairs
Tables
Equations
Identify the input and the output.
Then, write a function as an equation for the given information:
Meg earns a $5 flat fee plus $4.50 per student for a tutoring session.
(input, output)
(# of students tutored, Meg's earnings)
Function: f(x) = 4.5x + 5
Given the list of ordered pairs, create a mapping diagram.
Determine what type of relation the mapping diagram shows.
Determine if the relation is a function.
{(-2,2), (0,1), (-2,3), (3,-1), (0,3)}
{Mapping Diagram on slide}.
Many-to-Many.
Is not a function (-2).
Determine if the equation is linear. Explain. If it is linear, find the rate of change.
y = x2 + 4
Nonlinear.
Not in slope-intercept form (y = mx + b) because of the exponent (2).
What values of "a" would make the following relation NOT a function.
{(a, 1), (2, 3), (4,5)}
a = 2 and a = 4.