Lab Safety
Branches of science
Scientific Method
Graphing
Density
100
Name one way to stay safe when using fire in the laboratory!
Tie up hair
remove long sleeve jackets
Use tongs to grab material in flames/never use bare hands to touch hot objects
Turn off flame when not in use
100
True or false: all the branches of earth science interact with each other
True!
100
What are the 7 steps of the Scientific Method?
Observation, Ask Question, Background Research, Hypothesis, Experiment, Analyze, Share
100
What kind of graph is the following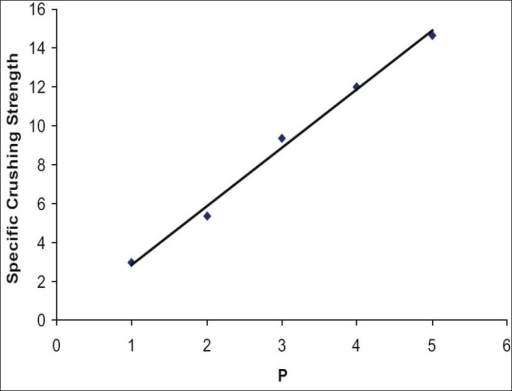
Direct Relationship
100
What is the formula for Density?
Density = mass/volume
200
Which hazard is this symbol warning us about?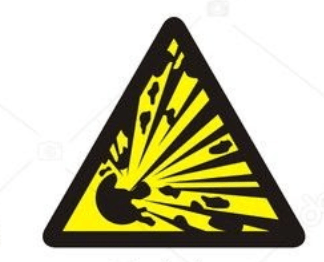
Explosions
200
What is Life Science?
The study of life and living things
200
"Lifting weights increases the breathing rate of a person."
What is the dependent variable of this sentence?
Breathing Rate
200
What kind of graph is this?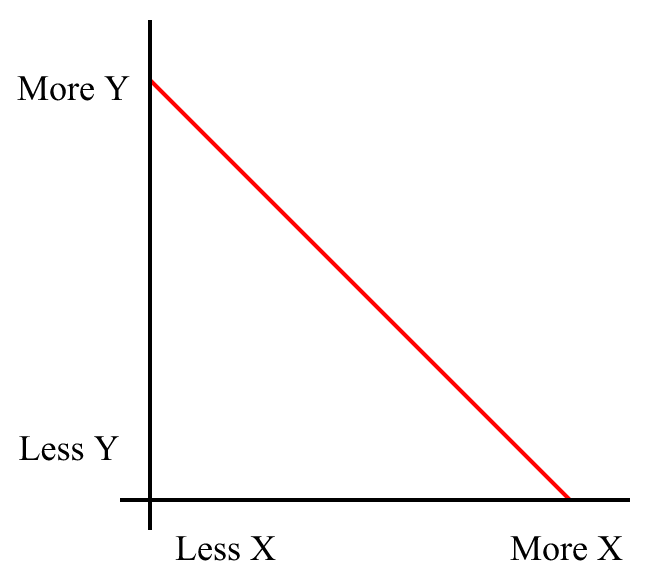
Inverse Relationship
200
Which liquid is the LEAST dense?
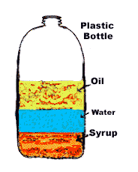
Oil
300
What is the most important rule of the laboratory?
Listen to your teacher
300
The study of the Earth's structure, properties, processes, and four and a half billion years of biotic evolution is which branch of science?
Earth Science
300
"Stress increases the heart rate of a person. "
What is the independent variable of this sentence
Stress
300
What kind of graph is this?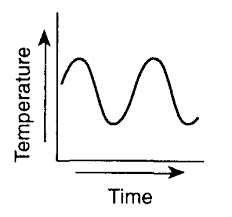
Cyclic relationship (change)
300
What is weird about water?
It is more dense in its liquid phase.
400
Demonstrate the proper way to smell chemicals
400
The study of inanimate natural objects, including physics, chemistry, astronomy, and related subjects is which branch of science?
Physical science
400
Make an observation based off of this picture.
Answers may vary
400
Where would the point (5,3) go on this graph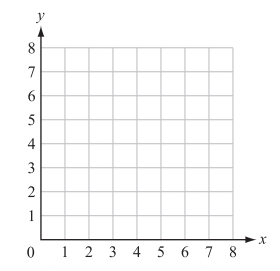
Show us!
400
Solve for density. Jaylah has a rock. The rock has a mass of 14 g and a volume of 2 cm3. What is the density of the rock?
7 g/cm2
500
What could happen if you skip directions while performing an experiment?
You could mix something you are not supposed to and cause an accident.
500
Name one area of study within the Life Science branch
Biology, ecology, environmental science, botany, Ornithology, etc.
500
Make an inference based off of this picture
Answers may vary
500
What is the benefits of using graphs in your data?
It makes it easier to see a trend or pattern or even predict data.
500
If temperature increases, what happens to the density?
It decreases