What three elements are contained in all of the biomolecules?
C, H, O
Carbon, hydrogen, oxygen
Identify this biomolecule: 
Carbohydrate
The function of this biomolecule is to provide energy. This is typically more of a short-term energy supply, but certain types are also useful for long term energy. Which biomolecule is being described?
Carbohydrate
The monomer of carbohydrates is:
Monosaccharides
Based on the characteristics of life, why are viruses commonly categorized as non-living?
Unable to reproduce on their own (require a host)
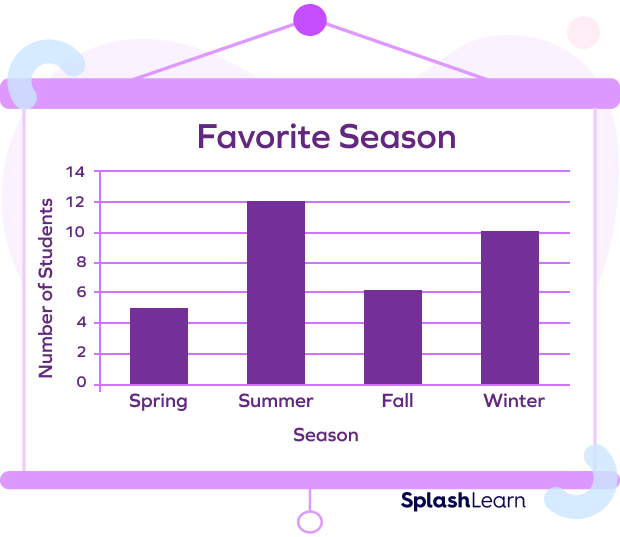
What type of graph is this?

Bar Graph
In an enzyme-substrate reaction, what is the name for the location where the substrate binds to the enzyme?
Active site
What element is only contained in Nucleic Acids?
Phosphorus (P)
Identify this biomolecule:

Nucleic Acid
The primary function of this biomolecule is heredity (genetic material). What is it?
Nucleic Acid
Nucleotides are the monomers of _________.
Nucleic Acids
The variable in an experiment that is being measured is the ___________ variable.
Dependent
What type of graph or chart would be best used to represent proportions or percentages?
Pie Chart
What term describes the process by which an enzyme loses its shape and function?
Denaturing
What biomolecule contains the elements C, H, O, and N?
Identify this biomolecule:

Lipid
The primary function of this biomolecule is long-term energy storage and insulation. What is it?

Lipid
Proteins are made up of these monomers (there are 20 different kinds of them):
Amino Acids
What is typically the LAST step of the scientific method?
Report or share findings
Which variable is graphed on the y-axis?
Dependent
List 3 factors that can affect enzyme activity
pH
Salinity
Substrate Concentration
Carbohydrates contain the elements C, H, and O in a specific ratio. What is that ratio?
1:2:1
Identify this biomolecule:
Protein
One of the functions of this biomolecule is to provide structure, such as the chitin found in insect exoskeletons and the cellulose found in plants. Which biomolecule is being described?

Carbohydrate
What is the name for the type of lipid that has three fatty acid chains?
Triglyceride
Lipids can be categorized as saturated or unsaturated. Briefly explain the difference between the two.
Unsaturated fats contain at least one double bond between carbons (C=C)
What conclusion can you draw about the relationship between temperature and time, given the graph below?
Hint: format your response as "As time ___________, temperature __________."

As time increases, temperature increases
What is the primary function of enzymes in biological systems?
Catalysts
Two of the groups of biomolecules contain the same three elements. Identify these two groups, and describe how you could differentiate between them based solely on chemical formula (ie, C6H12O6 or CH3(CH2)4COOH)
Carbohydrates & Lipids
Identify this biomolecule:

Protein
There are many different kinds of carbohydrates. Some of them provide really quick, short-term energy, while others release energy over a longer period of time. Provide an example of a carbohydrate that would provide the quickest/shortest supply of energy?
Varied Answers.
Example: Candy, sugar, cake, sweets, etc.
The monomer (single unit) of carbohydrates is called a monosaccharide. When there are many units, it is called a polysaccharide. What is the common/daily name for the carbohydrate disaccharide called sucrose?
Sugar or table sugar
Problem: Is one brand of paper towels stronger than the other when wet?
Experiment: Measure the strength of two brands of wet paper towels by measuring the number of marbles each wet towel will hold without tearing.
What is the DEPENDENT variable in this experiment?
The number of marbles
If you are examining the weight (in pounds) and the age (in years) of bears in the Smoky Mountains and trying to see if there is any correlation between the two, what type of graph/chart would be best to display your data?
Scatterplot/Line Graph
Based on the graph displayed below, identify a 20 degree range of temperatures that are optimal for this enzyme.

30-50