Plotting data
Types of Association
Vocabulary
Linear or No
Santa
100
This variable goes on the x-axis.
What is the independent variable.
100
What type of association does this graph show?
What is positive association.
100
A graph of plotted points that show the relationship between two sets of data.
What is a scatter plot.
100
Describe the association of the scatter plot.

What is a strong positive, linear association.
100
If there is no correlation-is the line positive or negative?
What is...There is no line!
200
This variable is impacted by the other variable and is placed on the y-axis.
What is the dependent variable.
200
What type of correlation is shown in the scatter plot?
What is negative association.
200
Distinct group formed by data points plotted on a scatter plot?
What is a cluster.
200
What is the association of this graph? Will the slope be positive or negative?

What is...This graph shows a negative association and a negative slope.
200
Solve the equation for x
-3x-20-12=-2(5-4x)
What is...x=-2
300
If I am graphing the number of shots made and the hours of practice for a player, which would be the independent variable?
What is the number of hours of practice.
300
What type of correlation is shown? Write a sentence describing the impact or lack of impact that shoe size has on math test scores.
What is... there is no correlation between shoe size and math test scores.
300
What is an outlier?
Which point is the outlier?

What is a point that is distant (skewed) from the rest of the data.
What is (1, 1)
300
Describe the association of the scatter plot.
Write a statement describing the relationship between the number of cavities and the amount of fluoride in drinking water.
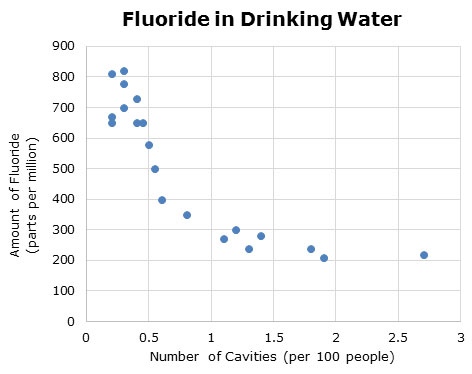
What is negative, nonlinear association.
What is...as the number of cavities increase the amount of fluoride in drinking water decreases making the association negative.
300
Find the equation of a line that passes through the points (1,6) and (3,-4)
What is...y=-5x+11