Plotting data/Interpret
Types of Association
Two Way Tables
Line of best fit
Misc
100
This variable goes on the x-axis.
What is the independent variable.
100
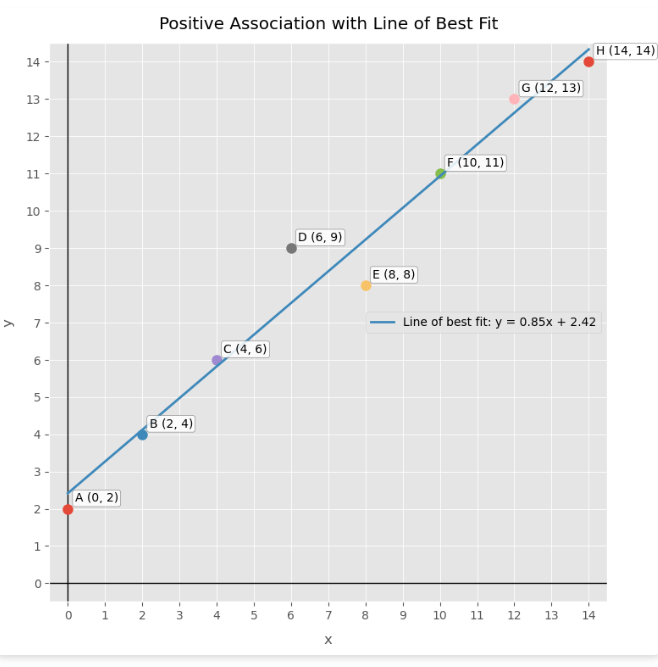
What type of association does this graph show?
What is positive association.
100
How many students were surveyed?
How can this be found in a table?

25, bottom right corner
100
Describe the association of the scatter plot.

What is a strong positive, linear association.
100
If there is no correlation-is the line positive or negative?
What is...There is no line!
200
This variable is impacted by the other variable and is placed on the y-axis.
What is the dependent variable.
200
What is the strength and association?
Weak positive association
200
How many more students have not been to Mexico than have been?
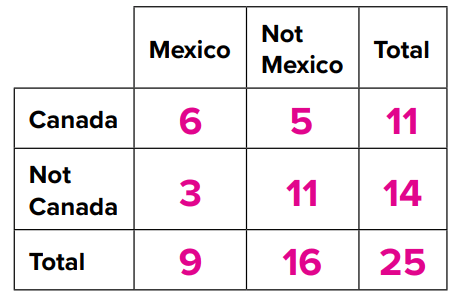
7 more
200
What is the association of this graph? Will the slope be positive or negative?
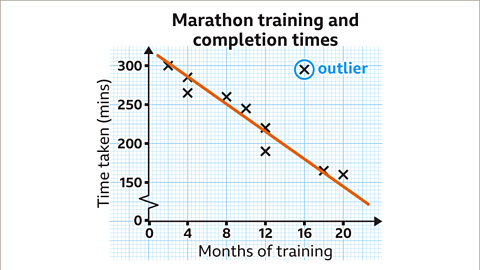
What is...This graph shows a negative association and a negative slope.
200
What is an outlier?
Which point is the outlier?
A point that is distant (skewed) from the rest of the data.
(10, 9)
300
Based on the scatter plot, what is the burning time for a candle that weighs 15 oz?
100 hours
300
What type of correlation is shown? Write a sentence describing the impact or lack of impact that shoe size has on math test scores.
What is... there is no correlation between shoe size and math test scores.
300
How many students have not traveled to either Canada or Mexico?

11
300
Plot the following and draw a line of best fit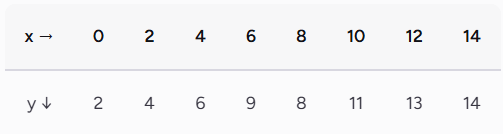
300
Distinct group formed by data points plotted on a scatter plot?
What is a cluster.
400
If I am graphing the number of shots made and the hours of practice for a player, which would be the independent variable?
What is the number of hours of practice.
400
Plot the following data. What is the association?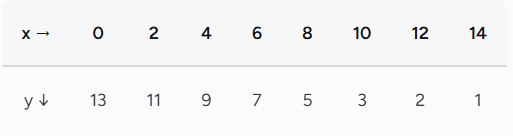
Linear negative association
400
What is an association between grade level and riding the bus?
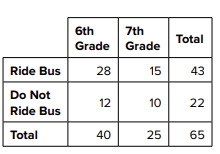
More 6th graders ride the bus than 7th graders.
400
Write an equation for the line of best fit

y = 100/15x or y=6.67x
400
Approx how many recipes were their 3 years after 2005?
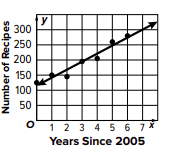
200 recipes
500
What is the best aprox. value of a car when it is 3 years old?

€ 7,500
500
What is the association between number of absences a student has and their test scores?
As the number of absences increase, their test scores decrease
500
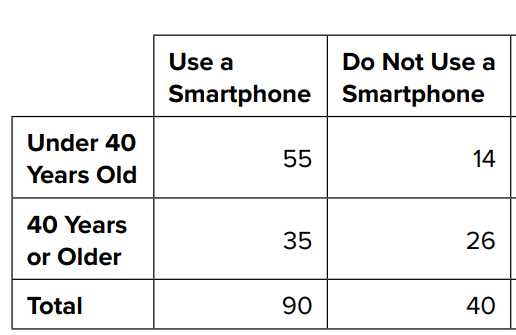
Construct a column relative frequency table for the following data.
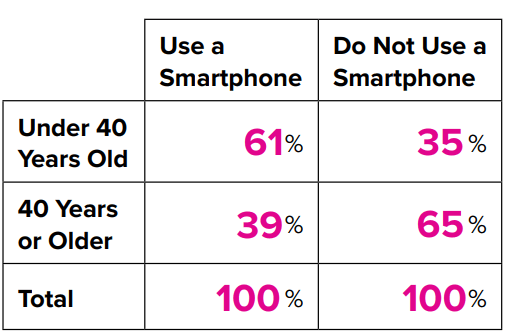
500
Write the equation of the line of best fit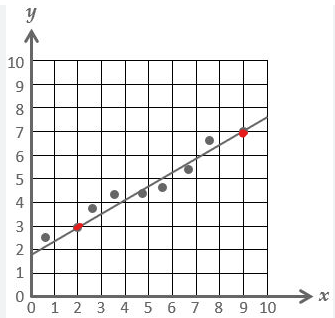
y=0.57x+1.86
500
What is the equation of the line of best fit?

y=-25x +170