Variables
Outliers and Predictions
Correlations
Line of Best Fit
100
This variable goes on the x-axis.
What is the independent variable?
100
What is an outlier?
What is a point that is distant (skewed) from the rest of the data?
100
What type of correlation does this graph show? (2 words)

What is weak negative?
100
How do you determine where to place the line of best fit?
It should come as close as possible to as many points as possible
200
This variable is impacted by the other variable and is placed on the y-axis.
What is the dependent variable?
200
Which point is the outlier?
What is approximately (30, 6000)?
200
What type of correlation is shown in the scatter plot?(2 words)

What is Strong Positive?
200
Two points on the line of best fit are (4, 85) and (2, 70). Find the slope for the line of best fit using these points.
15/2
300
If I am graphing the number of shots made and the hours of practice for a player, which would be the independent variable?
What is the number of hours of practice?
300
Based on the scatter plot this is how many emails you would expect a 50 year old to send.
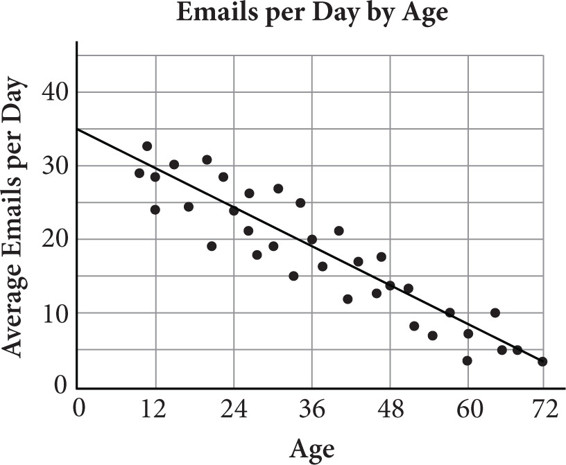
What is about 14 emails?
300
What type of correlation is shown?
What is no correlation?
300
What are two points on the line of best fit?
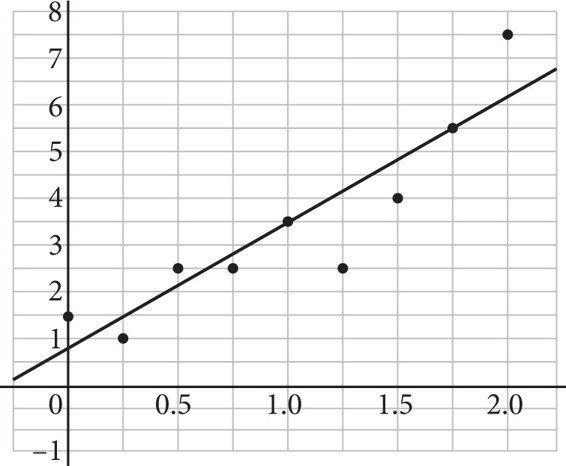
Two points on the line of best fit are: (1, 3.5) and (1.75, 5.5)
400
On a graph showing the relationship between salary and years of experience which variable would be the dependent variable?
What is salary?
400
You could go about this many miles with a fare of $220

What is about 1,200.
400
Describe what a positive correlation means for data.
When one variable increases the other variable will also increase.
400
Write the equation of a line of best fit in slope intercept form.
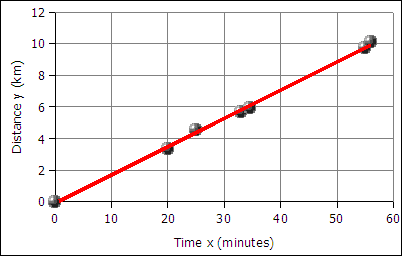
y = 1/5x + 0
y = 2/11x + 0
500
Write a sentence describing the relationship between the price of a diamond and the size in carats.

The cost of the diamond increases as the number of carats increases. Positive Correlation.
500
Describes the process of estimating by extending a pattern beyond the given data.
What is extrapolation?
500
If a scatterplot has no correlation what will the slope of the line of best fit be?
Not possible. No correlation means no line of best fit.
500
What is the line of best fit in point slope form

y - 30 = 7/9 (x - 34)
y - 23 - 7/9 (x - 25)