Associations
Trend Lines
Problem Solving
Two Way Tables
Vocabulary
100
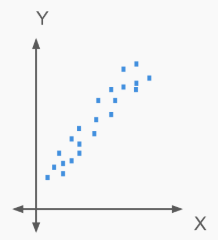
What is positive association?
100
The statement that best explains whether the trend line is a good fit for the data
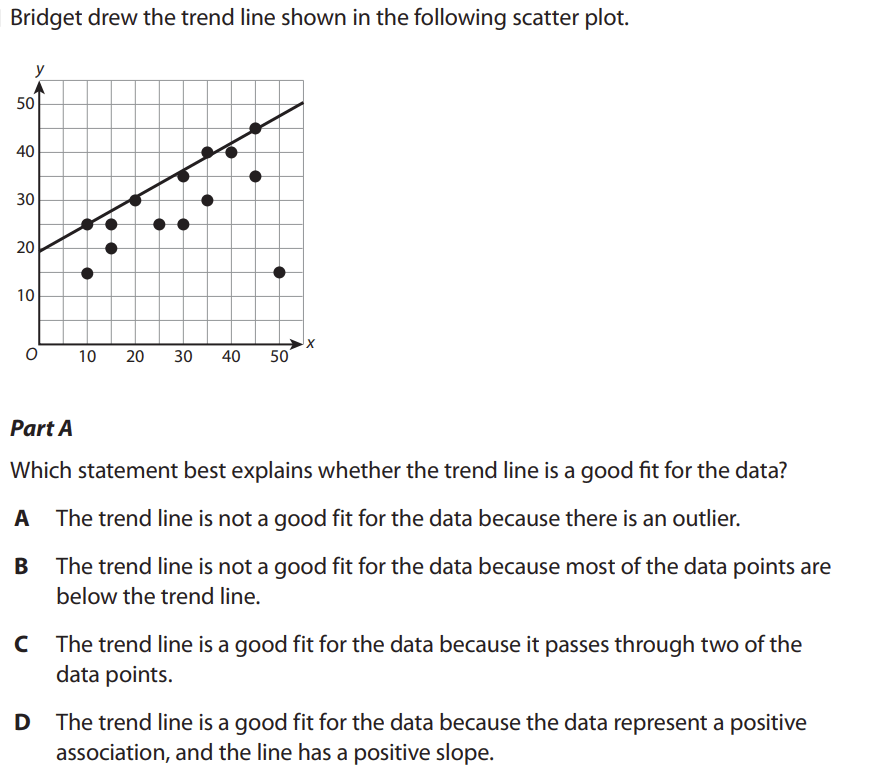
What is B - the trend line is not a good fit for the data because most of the data points are below the trend line.
100
The equation for the trend line shown.

What is y=-1/2x+5 ?
100
The number of 6th and 8th graders not going to the school play

What is 172?
100
A graph that shows two pieces of data for each person or object using dots. Each dot represents one pair of values.
What is "Scatterplot"?
200
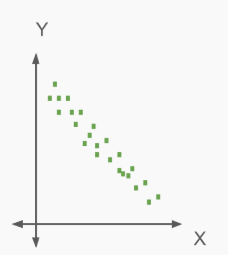
What is negative association?
200
The graph that shows the line of best fit

What is Graph B?
200
The equation for the line of best fit and the meaning of the slope in context

What is y=1.2x+2 and the time to write the report increases by 1.2 hours for each page written?
200
Proof that there is an association between buying a hot dog and buying a drink

What is about 70% of people who buy a hot hog also buy and drink AND about 39% of people who do not buy a hot dog also buy a drink?
200
A straight line drawn through the scatterplot that shows the general direction of the data. It helps make predictions.
What is "line of best fit" or "trend line"?
300
Shoe size and number of siblings
What is "no association"?
300
The order of the correct answers
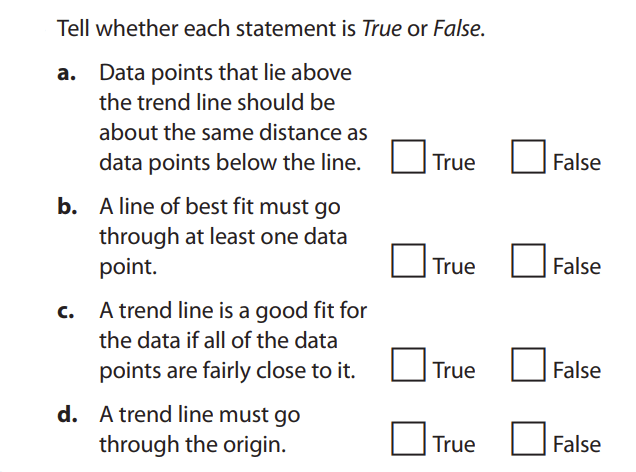
What is true, false, true, false?
300
The estimated weight for 15 containers of strawberries at Marty's Market

What is about 21.5 pounds?
300
The order of the correct answers

What is true, false, true, true?
300
A dot that is far away from all the other dots. It doesn’t fit the pattern of the rest of the data.
What is "outlier"?
400
Distance from a Wi‑Fi router and Internet signal strength
What is "negative association"?
400
The order of the correct answer choices


What is yes, no, no, yes?
400
The order of the correct answers

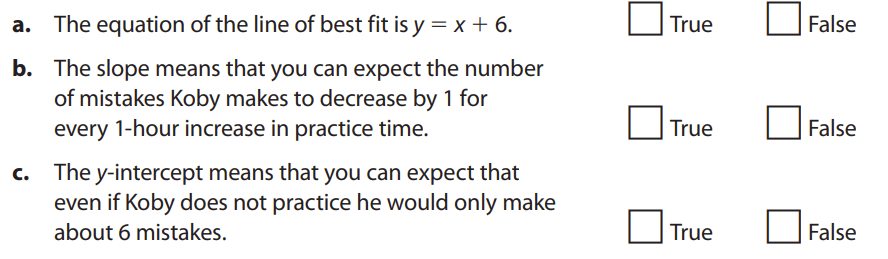
What is false, true, true?
400
All statements that are true

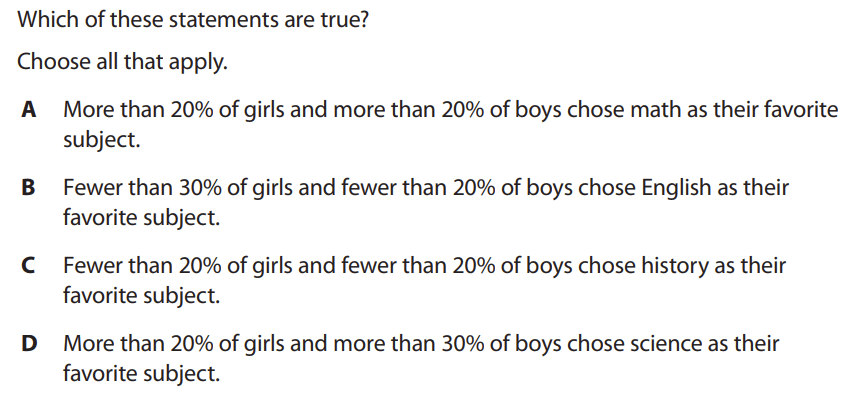
What are A, B, D?
400
A group of dots that are close together on the scatterplot, showing that several data points have similar values.
What is "cluster"?
500
Hours of sleep and energy level
What is positive association?
500
The predicted height of the plant after 13 days of growth

What is 8.5 inches?
500
The number of hours after opening you would predict that the fruit stand will sell out of oranges.
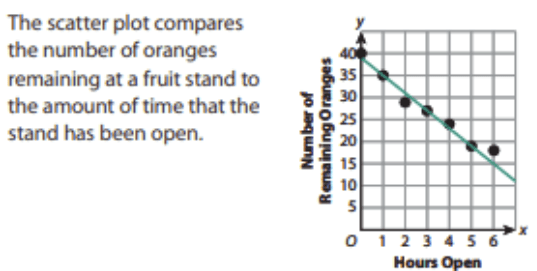
What is about 10 hours?
500
The percentage of those surveyed who do not have a job and do not play sports rounded to the whole percent


What is 28%?
500
When the dots don’t form any clear pattern. One variable doesn’t seem to affect the other.
What is "no association"?