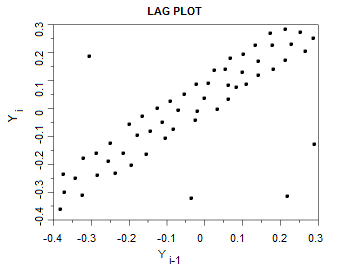
Is there a cluster in this scatter plot? If there is, point to it.
Yes, there is a cluster.
How many outliers are there in this scatter plot?
There is one outlier.
Is there a positive or negative correlation?
There is a positive correlation.

Is there a linear or nonlinear correlation?
There is a linear correlation.
How many clusters are in this scatter plot?
There are 2 clusters.

What is the point of the outlier in this scatter plot?
The point of the outlier in this scatter plot is (2, 16).
Describe this correlation.
A strong positive correlation.

True or false: This is a nonlinear correlation.
True.
Which cluster is bigger?
The green one.
Explain why there's an outlier in this scatter plot.
There's an outlier in this scatter plot because one of the data points is placed far from the rest of the data points.

Why is this a positive correlation?
This is a positive correlation because as x is increasing, y is increasing.

Describe this relationship.
A strong linear relationship.

Explain why there are clusters in this scatter plot.
There are clusters in this scatter plot because a group of data points are close together.

Which of these points is not an outlier: (140, 40) (175, 40) (145, 80) or (175, 69)?
(140, 40) and (175, 69)

Explain why this is a negative correlation.
This is a negative correlation because as x is increasing, y is decreasing.


Which of these scatter plots is linear?
The second scatter plot.

Why isn't there a cluster here?
Because the data points are spread out.

What are the outliers in this scatter plot?
Point (-0.3, 0.18), point (-0.04, -0.34), point (0.22, -0.34), and point (0.29, -0.13)

Why is this a strong negative correlation?
This is a strong negative correlation because the data points are close together and as one variable is increasing, the other is decreasing.

Explain why this is a nonlinear correlation.
This is a nonlinear correlation because the line is curved.
