Association
Predicting
Correlation
Line of Best fit
Random
Correlation - words
100
What type of association does this graph have?
Negative.
100
Based on the graph, if Joe earned $400, how many hours did he work?

25 hours
100
What is the correlation between length of running start and distance of jump?

positive: the further you run the further you jump
100
Which line best fits the data trend?
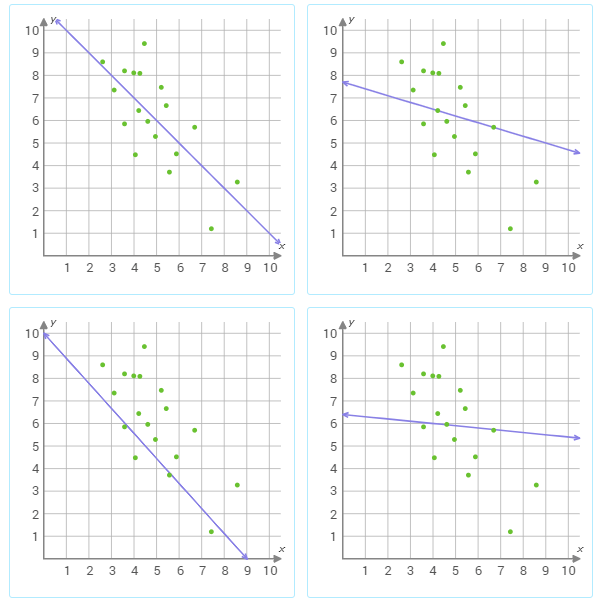
Line #1
100
What is the name of Shrek's wife?
Fiona
100
What type of correlation will these two variables have?
Temperature & Lemonade Sales
Positive
200
If a scatterplot has no association then...
...its ordered pairs have no predictable pattern
200
About how many male math teachers were there in 2006?

35
200
Describe the correlation in the graph shown.

Weak Negative
200
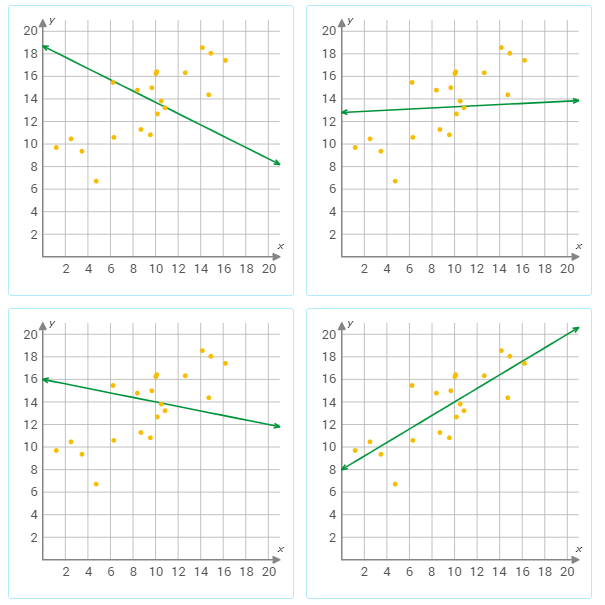
Which line best fits the data trend?
Line #3
200
What has to be broken before you can use it?
An egg
200
What type of correlation will these two variables have?
Eye color & Height
No Correlation
300
What is the type of correlation?

no association
300
Mrs. Collins made a scatterplot to show the relationship between the number of absences and a student’s final exam score. Based on this scatterplot, a student with 6 absences should get approximately what score on the final exam?

76
300
What type of correlation does this graph have?

positive
300
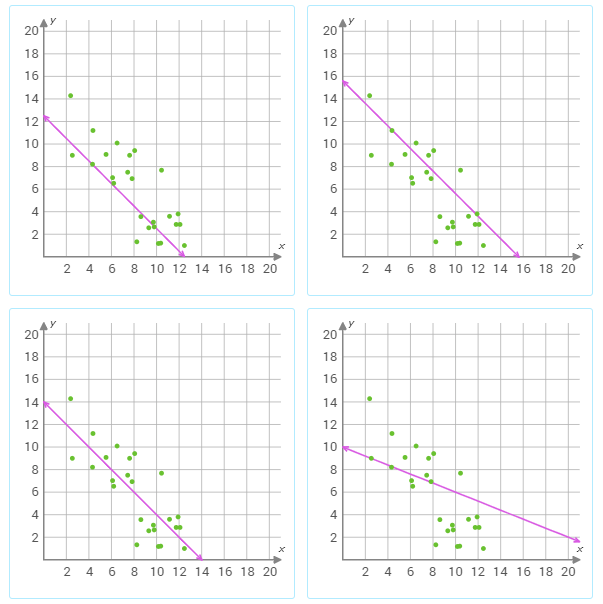
Which line best fits the data trend?
Line #4
300
There was a butcher who lived in town. He has brown hair, wears size 12 shoes and works every other day. What does he weigh?
Meat
300
What type of correlation will these two variables have?
Airline Ticket Prices & Number of travelers
Negative correlation
400
Describe the association between the number of lanes rented and the number of people bowling.

Positive linear association
400
The scatter plot shows the relationship between the number of chapters and the total number of pages for several books. Use the trend line to predict how many chapters would be in a book with 180 pages.

18 chapters
400
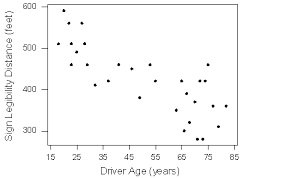
What type of correlation does this scatter plot show?

negative linear association
400
Kari has a large family with many cousins. This scatter plot shows the ages and heights of some of her cousins along with the line of best fit. What height could we predict a 1 year old cousin to be? 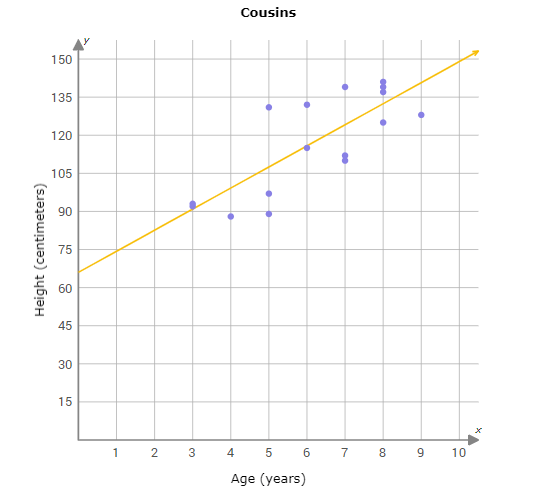
75 centimeters
400
Find the volume of the cylinder.
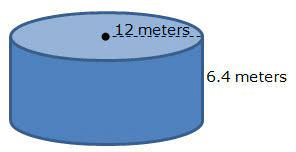
2,893.824 meters3
400
What type of correlation will these two variables have?
Hours spent at the pool & number of wrinkles on your fingers/toes
Positive
500
Describe the association for the graph.

Non-Linear and No association
500
What does the point (30,80) represent on the scatter plot?
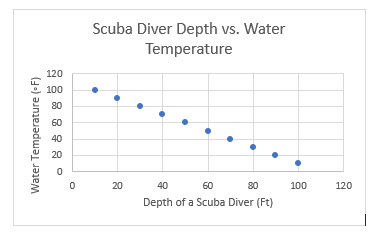
When the scuba diver is at a depth of 30 ft, the water temperature is 80 degrees Fahrenheit.
500
What type of correlation (association)?
The outside temperature and the amount of layers you wear.
Negative correlation
500
What is a line of best fit used for?
To make predictions
500
What is the Volume of the cone?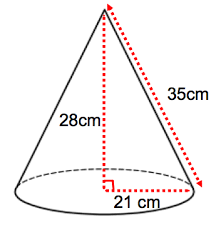
12,924.24 cm3
500
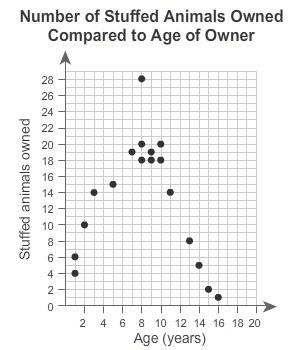
What type of correlation will these two variables have?
Age (in years) & Number of stuffed animals owned
Non-linear