Vocabulary
Describing Associations
Vocabulary pt. 2
Random
100
A graph with points to show the relationship between two sets of data
Scatter plot
100
Describe this association.
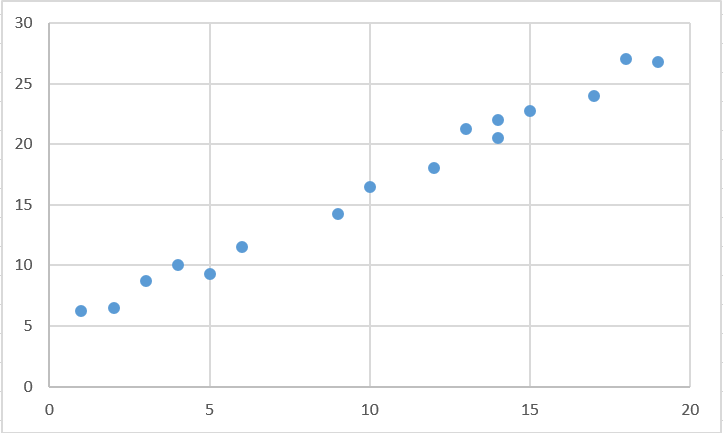
Strong, Positive, Linear
100
When BOTH variables INCREASE, this is called a ______________ correlation?
Positive
100
My Favorite Animal

200
A group of points that occur together.
DOUBLE TROUBLE
Cluster
200
Describe this association
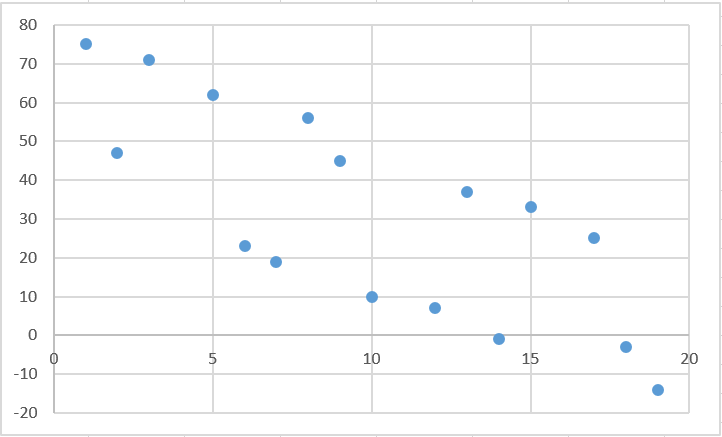
Weak, Negative, Linear
200
When one variable INCREASES while the other variable DECREASES, this is called a ______________ correlation?
Negative
200
What is the name of the bridge that connects the upper and lower peninsulas in our state?
Mackinac Bridge

300
A data point that is very different from the rest of the data
outlier
300
Describe the association:
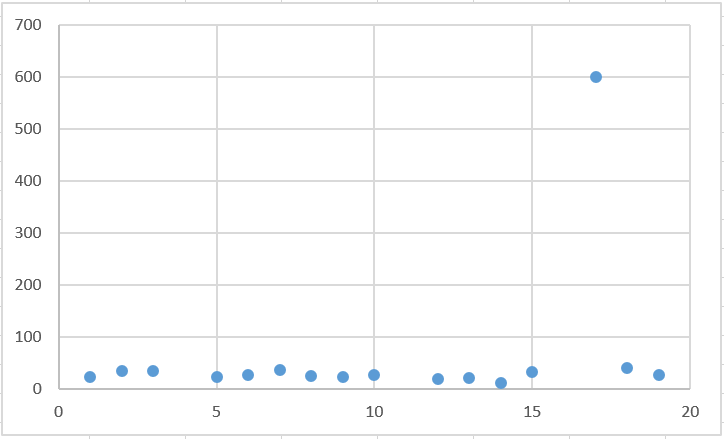
No association, with an outlier
300
The LINE we sometimes draw through our data points is called ___________ __ _________ ___________
DOUBLE TROUBLE
Line of best fit
300
What is the date of the last day of school?
June 6
400
A line on a scatter plot that helps show the correlation between data sets more clearly
Normally goes through at least 2 points
line of best fit
400
Describe the association
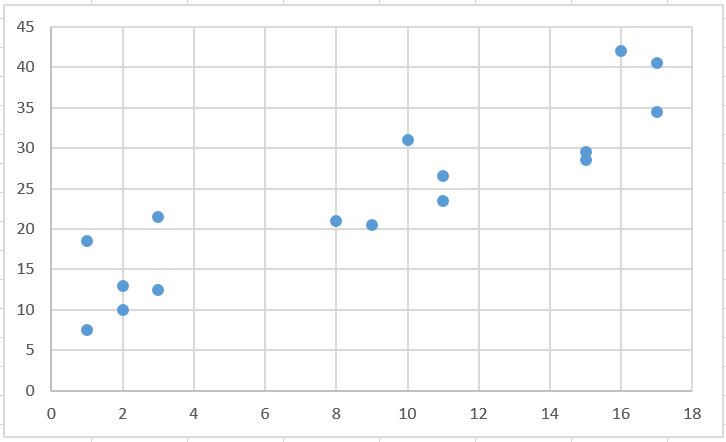
Moderate, Negative, Linear
400
If there is NO relationship between variables, this is called a _______________ correlation.
NO
400
What goes up but never back down?
Your Age!
500
Area on the graph that contains no data.
a gap
500
Describe the association
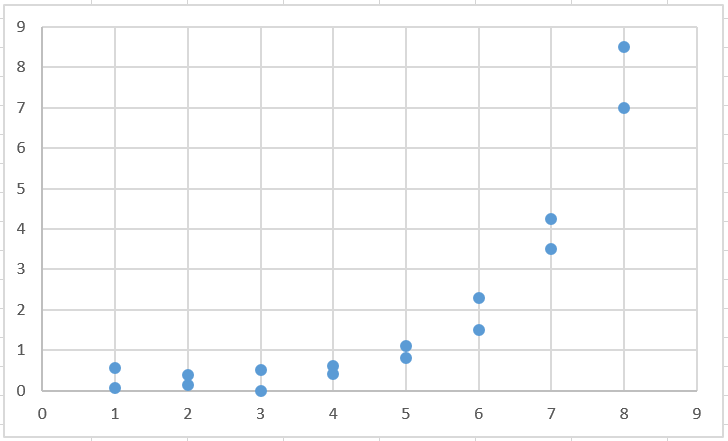
Strong, Positive, Nonlinear
500
When data points are CLOSE together, this can be described as ______________.
YAKITY YAK!!! TAKE IT ALL BACK!!
STRONG

500
A deck of cards!!!