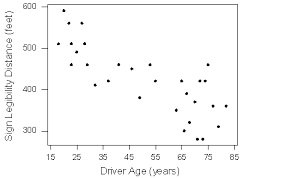
weak negative

25 hours

A graph with points to show the relationship between two sets of data
Un gráfico con puntos para mostrar la relación entre dos conjuntos de datos.
Scatter plot
35 teachers
A group of points that occur together.
Un grupo de puntos que ocurren juntos.
Cluster
75, 76, or 80

strong positive
A data point that is very different from the rest of the data
Un punto de datos que es muy diferente del resto de los datos.
Outlier
Describe the correlation coefficient between the number of lanes rented and the number of people bowling.
strong positive

y = 10x + 0

A line on a scatter plot that helps show the correlation between data sets more clearly.
Normally splits the data set in half.
Una línea en un diagrama de dispersión que ayuda a mostrar la correlación entre conjuntos de datos con mayor claridad. Normalmente divide el conjunto de datos por la mitad.
Line of best fit
Describe the correlation coefficient for the graph.
Write the line of best fit for the following graph below:

y = -0.5/0.2x + 15.5
a number that is between -1 and +1 that indicates the relationship of two variables
Correlation Coefficient


