Variables
Correlations
Line of Best Fit
Reading & Creating Scatter Plots
100
This variable goes on the x-axis.
A. Independent
B. Dependent
C. Neither
A. What is the independent variable.
100
What type of correlation does this graph show?
A. Positive
B. Negative
C. No correlation
A. What is Positive
100
What is an outlier?
A. A point in a set of data
B. A point that is skewed from the rest of the data.
C. A distant friend
B. What is a point that is distant (skewed) from the rest of the data?
100
What is the first step in creating your own scatter plot?
A. Plot your data points.
B. Determine your variables.
C. Choose your scale.
D. Analyze your data.
What is B. Determine your variables.
200
This variable is impacted by the other variable and is placed on the y-axis.
A. Independent
B. Dependent
C. Neither
B. What is the dependent variable?
200
What type of association does this graph have?
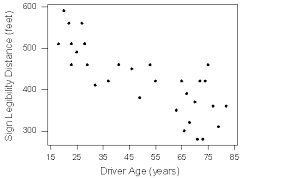
A. Weak Positive
B. Strong Positive
C. Strong Negative
D. Weak Negative.
D. What is weak negative
200
Which scatter plot shows a linear relationship between x and y?
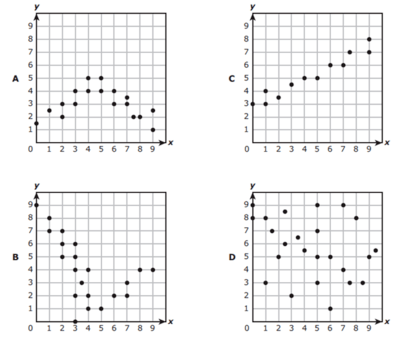
A.
B.
C.
D.
What is C
200
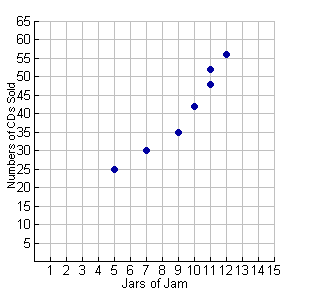
If this chart was your data, what would be an appropriate scale for the y axis?
A. 0, 2, 4, 6, 8, 10
B. 1, 5, 10, 15, 20, 25
C. 0, 20, 40, 60, 80, 100
D. 0, 50, 100, 150, 200, 250
What is C. 0, 20, 40, 60, 80, 100
300
If I am graphing the number of shots made and the hours of practice for a basketball player, which would be the independent variable?
A. Shots made
B. Hours of practice
C. Basketball players
B. What is the number of hours of practice?
300
What type of correlation (association)?
The outside temperature and the amount of layers you wear.
A. Positive correlation
B. Negative correlation
C. No correlation
D. All of the above
B. What is a negative correlation
300
If a person is 45 years old, based on the scatter plot, what should they expect their income to be?
A. 20,000
B. 45,000
C. 50,000
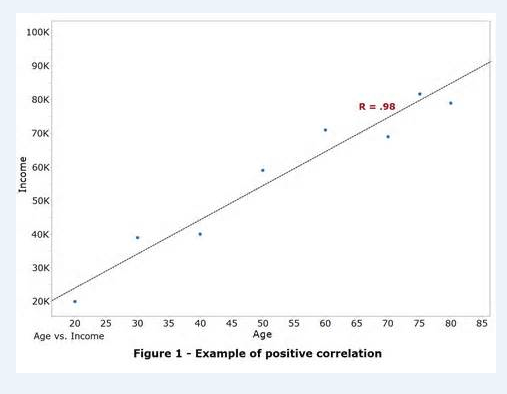
What is C. 50,000
300
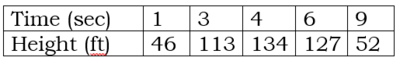
Based on the graph, if Joe earned $400, how many hours did he work?
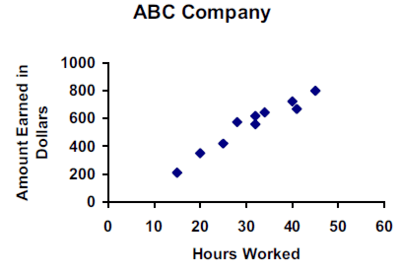
A. 25 hours
B. 35 hours
C. 45 hours
D. 15 hours
What is A. 25 hours
400
On a graph showing the relationship between salary and years of experience which variable would be the dependent variable?
A. Salary
B. Years of experience
C. Independent variable
A. What is salary?
400
What type of correlation would the number of siblings you have and your weight.
A. Positive correlation
B. Negative correlation
C. No correlation
D. All of the above
C. What is no correlation
400
The following scatter plot shows Pam's training as she prepares to run a 6 mile race at the end of the month. Which of the following would be a reasonable approximation for the length of time it would take for her to run 6 miles?
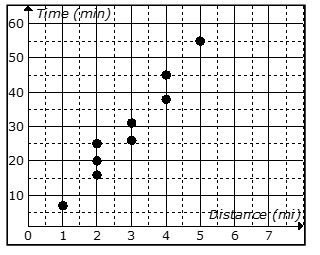
A. 50 min
B. 80 min
C. 45 min
D. 60 min
What is D. 60 min
400

When is the last day of QUARTER 3?
A. March 12th
B. March 19th
C. March 20th
D. March 21st
What is B. March 19th
500
Write a sentence describing the relationship between the average daily temperature and the number of beach visitors.
A. As the temperature decreases, the beach visitors increases.
B. As beach visitors increases, the average daily temperature increases
C. As the temperature decreases, so does the beach decreases.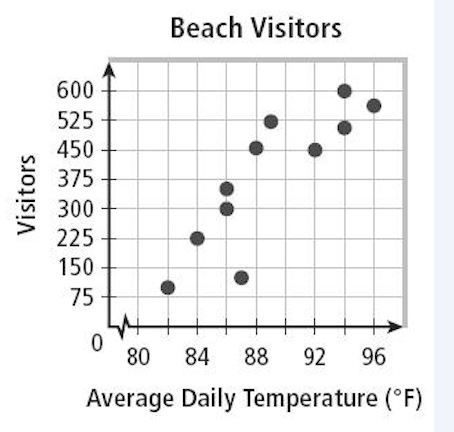
B. The number of beach visitors increases as the average daily temperature increases.
500
You are analyzing a scatter plot that has a negative correlation. What is true of the of the x and y values?
A. As x increases, y decreases
B. As x increases, y increases
C. As x decreases, y decreases
A. As x increases, y decreases
500
What is the equation for this line of best fit?
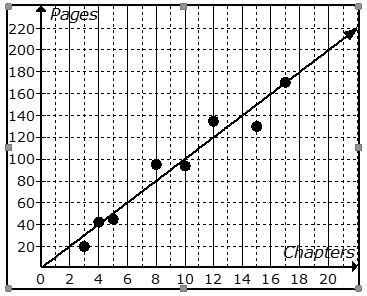
A. y = 10x + 10
B. y = x
C. y = 10x
D. y = x + 10
What is C. y = 10x
500
About how many male math teachers were there in 2006?
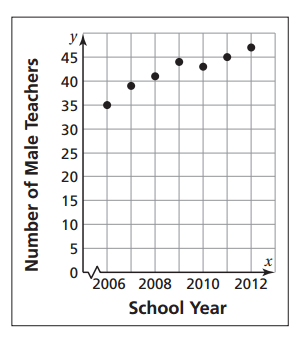
A. 15
B. 30
C. 35
D. 45
C. What is 35