Correlations + or -
Trend Lines
Two - Way Tables
Two-Way Tables Percents
Vocabulary
100
What is negative correlation?
100
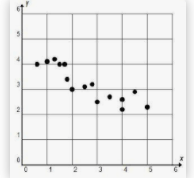
A line of fit should be____of the data points
Through the middle
100
How many total on Honor Roll?
68
100
What percent of students with a math average of 90 or more speak a foreign language? Round to the nearest percent
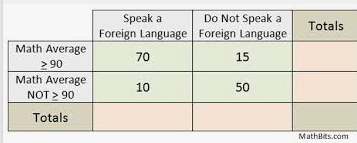
82%
100
What is the term used for a piece of data that does not fit with the rest of the data?
Outlier
200
Name the correlation
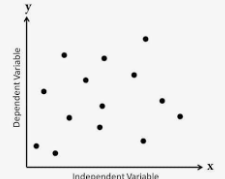
What is no correlation?
200
What is a trend line used for?
predicting data
200
How many total have No Curfew?

38
200
What percent of students do not speak a foreign language and have a math average greater than or equal to 90? Nearest percent

10%
200
When creating a line of best fit based on the given data points, what should you do?
Circle the data and put the line through the middle (think hot dog bun and hot dog).
300
In general, the more one eats the less hunger they feel. This would be _____correlation.
What is negative corrleation?
300
Write the equation for the line of fit shown.
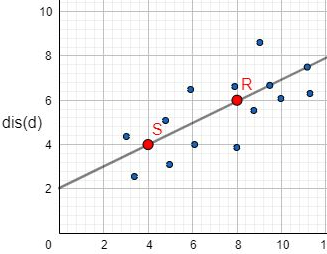
y = 1/2 x + 2
300
What total for No Honor Roll?

63
300
What percent speak a foreign language and have a math average not greater than or equal to 90?

7%
300
What is the term for a line on a scatter plot, drawn near the points that approximates the association between the data sets?
line of best fit
400
This describes the correlation between time running on a treadmill and calories burned.
What is positive correlation?
400
Which line is the best model of the data?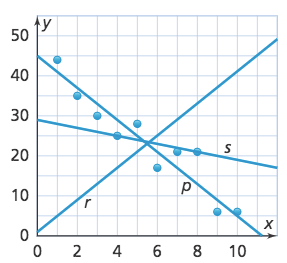
What is Line "P"?
400
How many total students were surveyed?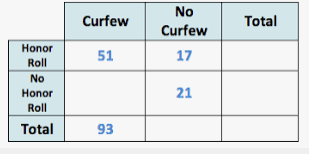
131
400
What percent do not play basketball nor football?
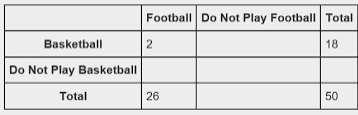
16%
400
The term cluster means what?
a group of points that lie close together
500
As temperature increases, the speed at which molecules move increases. Identify the type of correlation.
Positive
500
Predict the belly width for a length of 135 cm
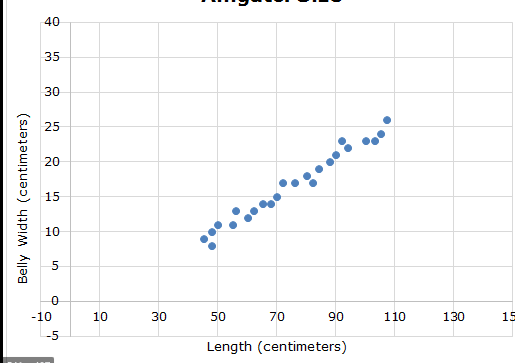
any number over 30 and less than 35 cm
500
What is the grand total for the 2 way table?
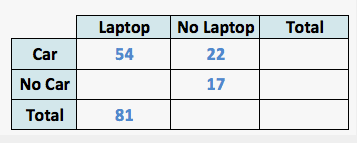
120
500
90 new drivers were surveyed after they took their driving test. 30 of those drivers passed. What percent that had 20 or over lessons failed? Round your answer to the nearest tenth.
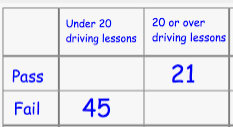
16.7%
500
What are the three types of association?
positive, negative, and no association.