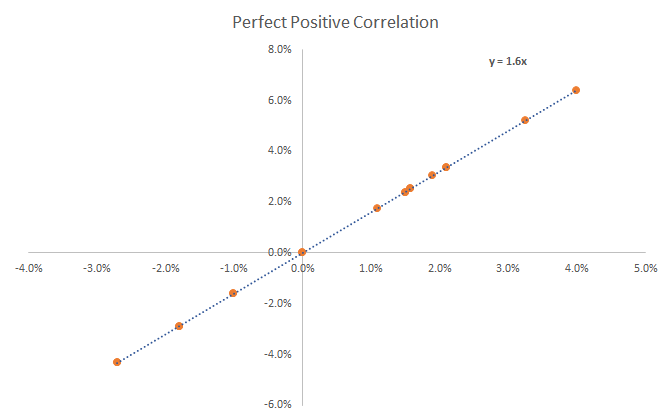
What is clustering?
Be or come into a cluster or close group; congregate.
What is an outlier?
Data point that differs significantly from other observations.
What is a positive correlation?
If the trend line is increasing it is positive.
What is negative correlation?
If the trend line is decreasing it is negative
What does linear association mean?
The straight or nearly straight trend line on a scatterplot.
What letter is used to represent the y-intercept?
b
What type of line test do you run on a graph to see if it is a function?
Vertical Line Test
Is this scatterplot clustered?
No, they aren't in a big clump, they are in a line.
Are there any outliers in this scatterplot?
Yes, one point doesn't belong to the group.
Is this a positive correlation?
Yes, it is increasing.
Is this a negative association?
Yes, the trend line is decreasing.
What is a nonlinear correlation?
When the trend line on a scatterplot is not in a line.
What letter is used to represent slope/trend line equation?
m
True or false: the following is not a function
(2, 5), (5, 2), (3, 4), (-2, 5), (-3, 4), (-5, 4)
Is this clustering?
Yes, the dots are in a big clump on the scatterplot.
Are there any distinct outliers?
No, there are no distinct outliers
Is this a positive association?
No, there is no association.
Is this negative correlation?

Yes, the tren line is decreasing.
Is the trend line linear or nonlinear?
How do we find the slope of a graph?
Rise/run
count how many up/down and how many to the right
True or False: If y is a function of x, x can not repeat.
How many clusters are there in this graph?
There are 3 clusters.
How many distinct outliers are there?
There are 2 distinct outliers.
What is the difference between a correlation and association?
They mean the same thing, there is no difference!
Is this negative correlation?

No, the trend line is increasing.
Is the line linear or nonlinear?

It is nonlinear, it curves.
What is the equation for this line?
y = x + 60
slope is 10/10 which is equal to 1
What type of representation of functions is missing?
Coordinate points, graphs, table, and ___...
Maps
What is the difference between these two scatterplots?
One of them is pretty organized and doesn't have outliers, the second one is messy.
How many distinct outliers are there?
There are 3.
Is this a positive association?

No, it is a negative association.
Is this a negative association?

No, there is no association
What is another term for the trend line that is used?
 Using the graph what would the student score be if they studied for 60 minutes?
120
Which statement is true about the following coordinate points?
(7,10), (8,10), (12, 10), (-7,10), (-10,10)
A. The mapping represents y as a function of x, because each x-value corresponds to exactly one y-value
B. The mapping does not y as a function of x, because two values of x-values correspond to the same y-value
A
