Scatterplot Facts
More Scatterplot Facts
Line of Best Fit
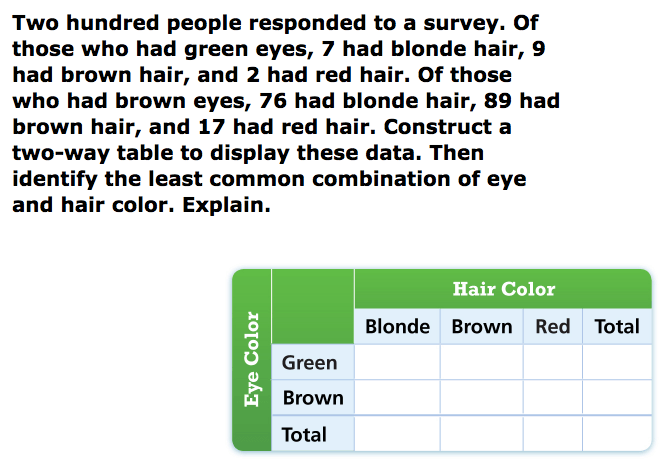
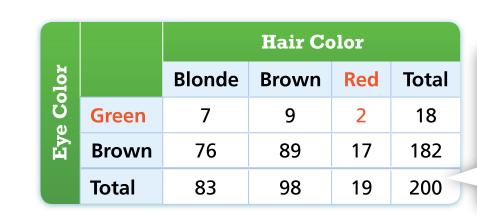
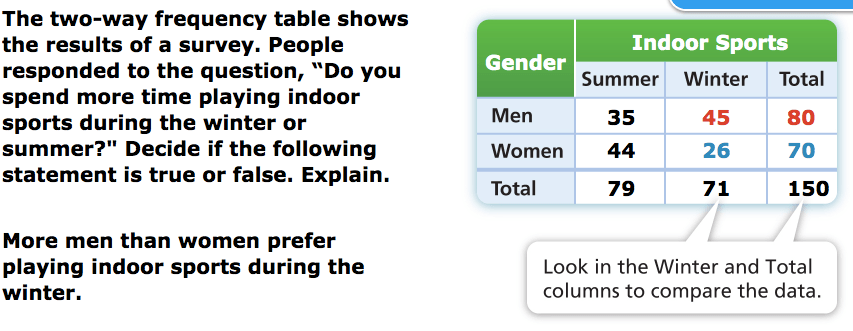
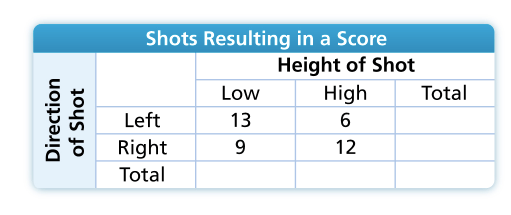
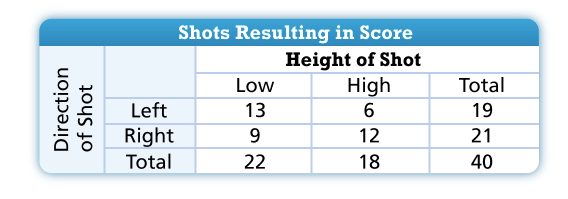
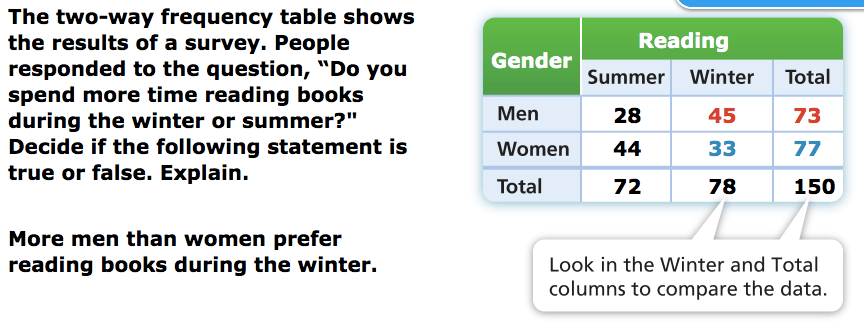
Two Way Tables
Relative Frequency
100
What is an Outlier?
Outliers are plots that are away from a cluster.
100
What would a weak positive association look like?
A positive trend line, with plots off and not close to the trend line.
100
What is a trend line?
The line of best fit in a scatter plot
100
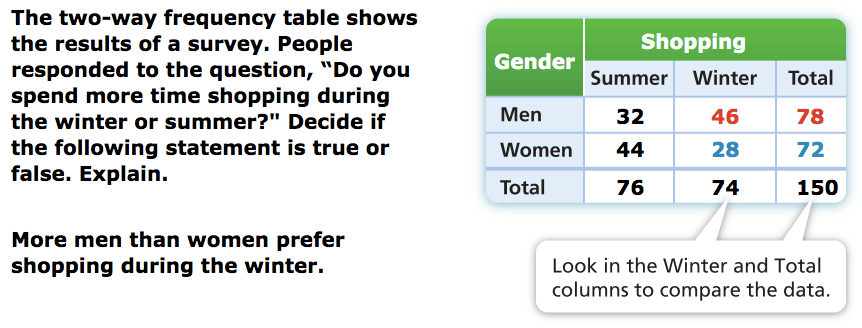
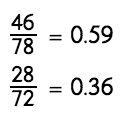 True
True
100
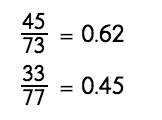
What is the difference between a two-way frequency table and a relative frequency table?
One has just data while the other has percents
200

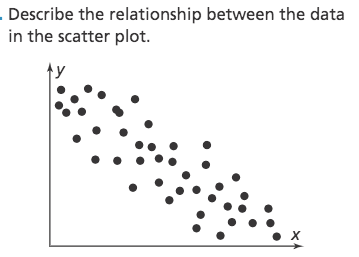
Positive Association
200
Positive or Negative Association? Treadmill running time and calories burned
Positive linear association
200

Around 10
200
200
What are the different ways you can express a relative frequency table?
Percents, ratios, and decimals
300
What is a positive association? What is a negative association? MUST HAVE BOTH ANSWERS!
Positive = going up
Negative = going down
300
Weak negative linear association
300


Around 800 people
300
 True
True
300
Normal

400

Negative Association
400
Which line is the best model of the data?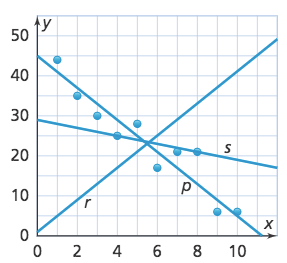
Line p
400

y=2x+5
400
400
Row

500

No Association
500
How do you know if a scatter plot shows a nonlinear relationship?
The points in the scatter plot to form a curve or circle.
500

y=16/5x+2
500
True
500
Column
