General Science
Graphing
Energy
Collisions
Random
100
An observation made with your senses
Qualitative
100
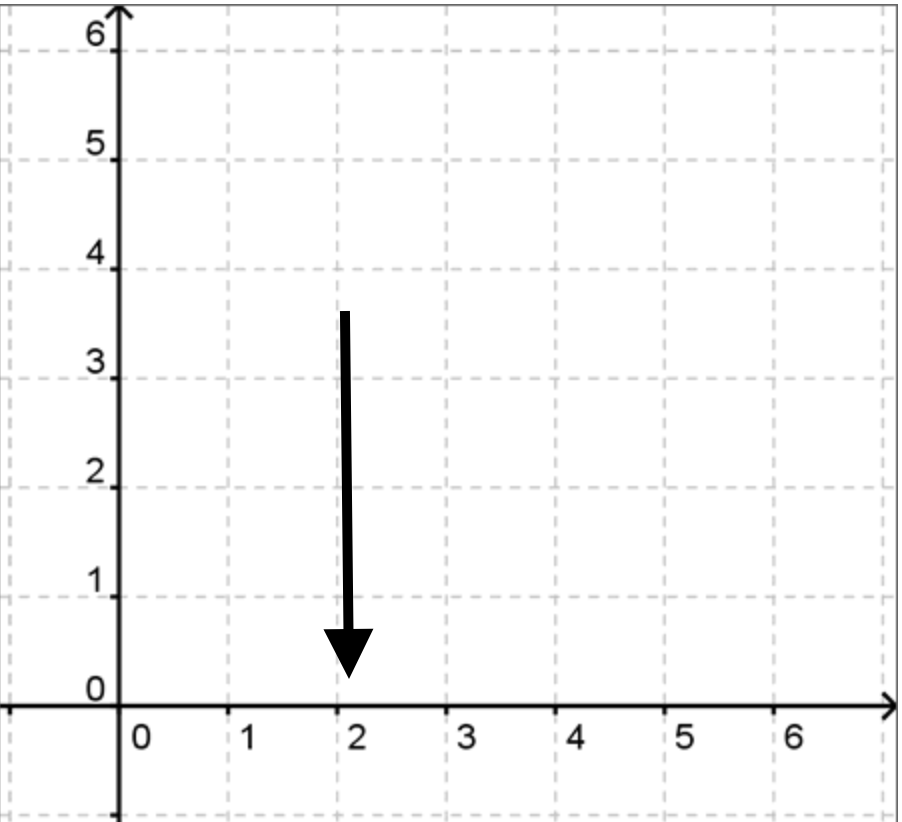
X Axis
100
Energy of motion
Kinetic Energy
100
When two things come in contact with one another.
Collision
100
The variable that stays the same in a science experiment.
Control
200
Observations that involve numbers or measuring something
Quantitative
200
What variable is graphed on the x axis?
Independent
200
Stored energy (energy waiting to be used)
Potential Energy
200
A push or pull interaction that occurs when an object comes into contact with another object
Contact Force
200
In a collision, movement of the objects involved is caused by?
Energy Transfer
300
An educated guess based on what you know
Inference
300
What variable is graphed on the Y axis?
Dependent
300
Energy moved from on object to another
Energy Transfer
300
When an object bends or changes shape
Deformation
300
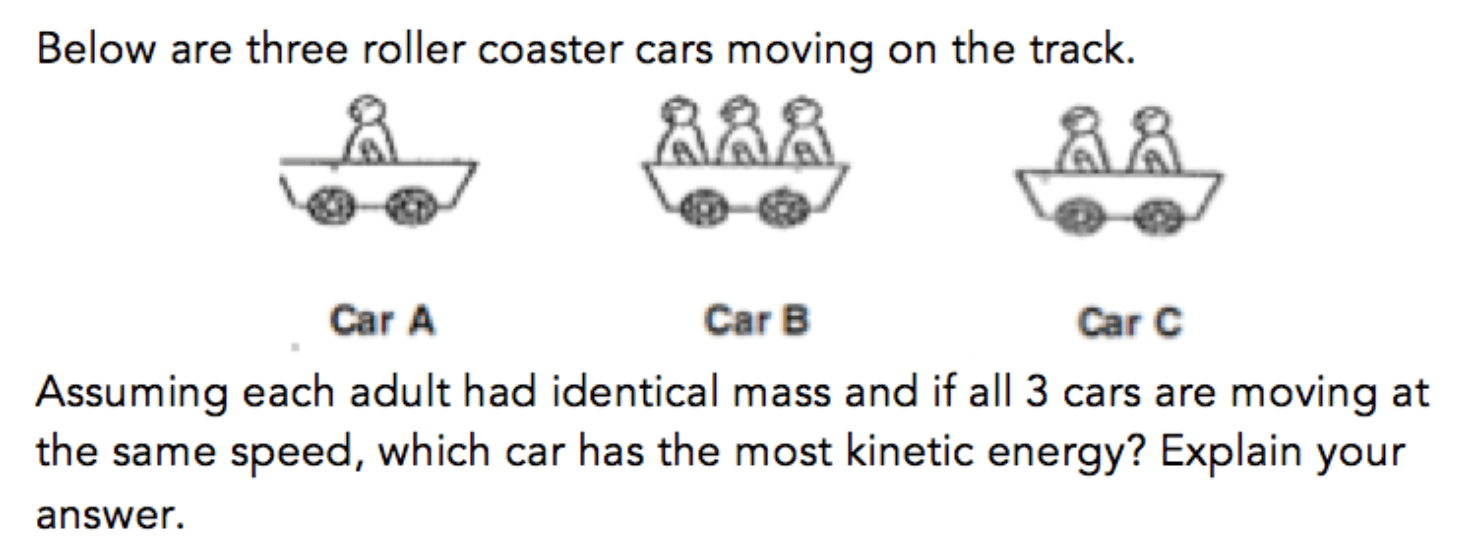
B. More Mass
400
The variable that changes in a science experiment
Independent
400
If you wanted to track your grades by month for science class, what type of graph should you use?
Line
400
Energy changing from on for to another
Energy Transformation
400
What is elastic limit?
The largest amount of force or deformation a material can withstand before permanent deformation.
400
The variable we measure or observe the effects on
Dependent
500
The scientific process has 6 steps.
1. Observe a phenomena
2. Ask a question
3. Make an inference
4. Set up an experiment
5. ?
6. Draw conclusions
Analyze Data (collect evidence)
500
Other than the data, graphs should include what 3 things:
Labels, Legend(Key), Title
500
Kinetic Energy is affected by:
1. Mass
2. Speed
500
Two things occur during collisions that cause damage (whether it is temporary or permanent). These are:
Energy transfer and Force
500
The force on both objects in a collisions is:
1.
2.
Equal and in opposite directions