Vocabulary
Variables
Steps
Data/Graphing
Good Scientist
100
The process that scientist use to learn about the natural world?
Scientific Method
100
The things in an experiment that are kept constant or the same through the whole experiment are called the ____________.
Controlled Variables
100
Students notice that the fall leaves of a sugar maple trees turn red, but the leaves of the black oak trees turn brown. The students are making a _________.
an observation
100
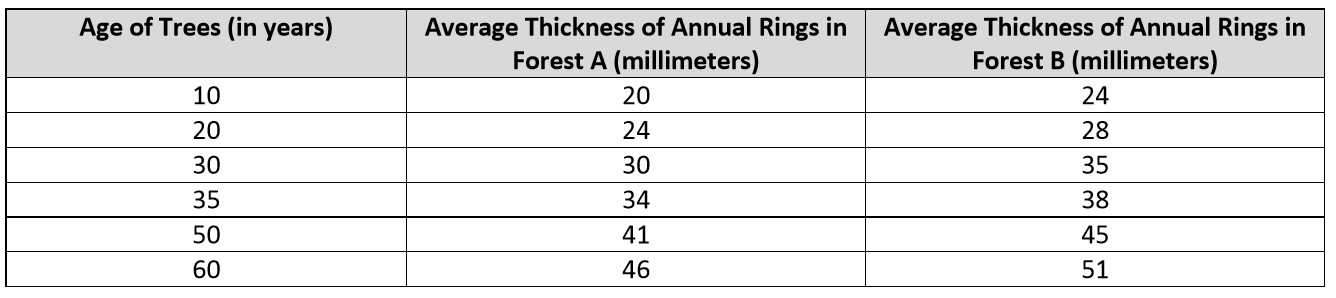
Based on the data table, what is the Independent variable and the Dependent variable?
Independent = Age of Trees (years)
Dependent = Average thickness of Annual Rings
100
What does a scientist need to do if they want their results to be accurate?
conduct multiple test of the same experiment
200
A statement of what you think will happen and why is called a ____________. It is also always written in an if and then statement.
Hypothesis
200
If Sam was completing an experiment to determine if fertilizer makes a plant grow better than not using fertilizer, which of the following would be the Independent Variable?
a. plant growth
b. fertilizer
c. water
d. sun light
b. fertilizer
200
What step of the scientific method is always written in the form of a question?
Problem
200
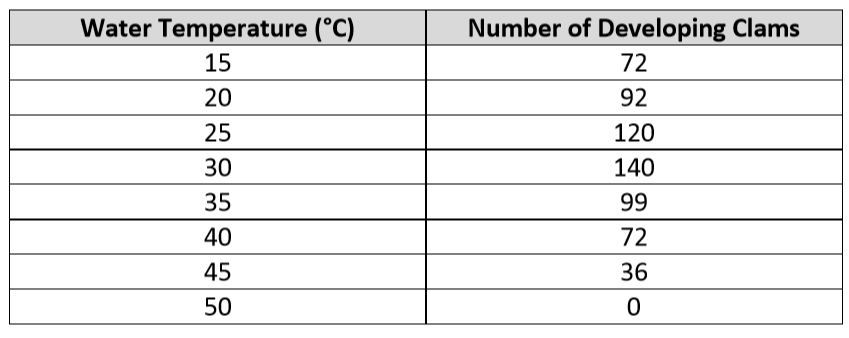
Based on the data, what would go on the x-axis and y-axis of a graph?
X-axis = Water Temperature
y-axis = number of developing clams
200
If a hypothesis is accepted, it means that the hypothesis was ____.
Right
300
The dependent variable is the ___________.
Results you are measuring, counting or observing.
300
If Sam was completing an experiment to determine if fertilizer makes a plant grow better than not using fertilizer, which of the following would be the Dependent Variable?
a. plant growth
b. fertilizer
c. water
d. sun light
a. plant growth
300
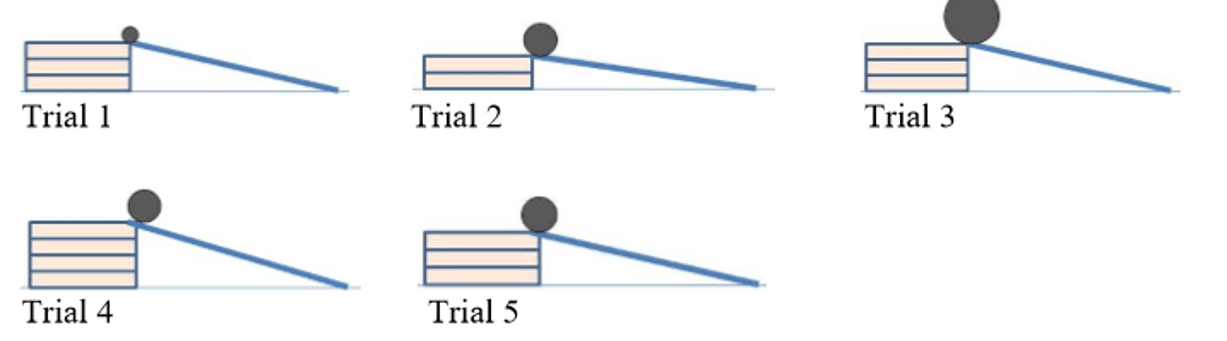
Linda wants to test this idea: if the ramp is placed higher, the ball will travel to the bottom of the ramp faster. Which three trials should Linda compare to test this idea?
Trials 2, 3, and 4.
300
What type of graph should you make?
Bar Graph
300
After selecting the three trials to compare, Linda measured the time it took for the ball to travel to the end of the ramp. She repeated each trial 10 times and recorded her data. What is the main reason Linda collected 10 measurements for each of the 3 trials?
a. to increase the reliability of her data
b. to list all the results in a table or graph
c. to change the experimental conditions
d. to check that the equipment is working
a. to increase the reliability of her data
400
The factors that can be changed and affect the experimental results are called __________.
Variable
400
A student hypothesized that the amount of sunlight a sunflower plant receives determines the number of sunflower seeds the plant produces. In her experiment, the number of seeds produced is the _______.
Dependent Variable
400
The "if" part of a hypothesis is the same as the ____ variable.
Independent Variable
400
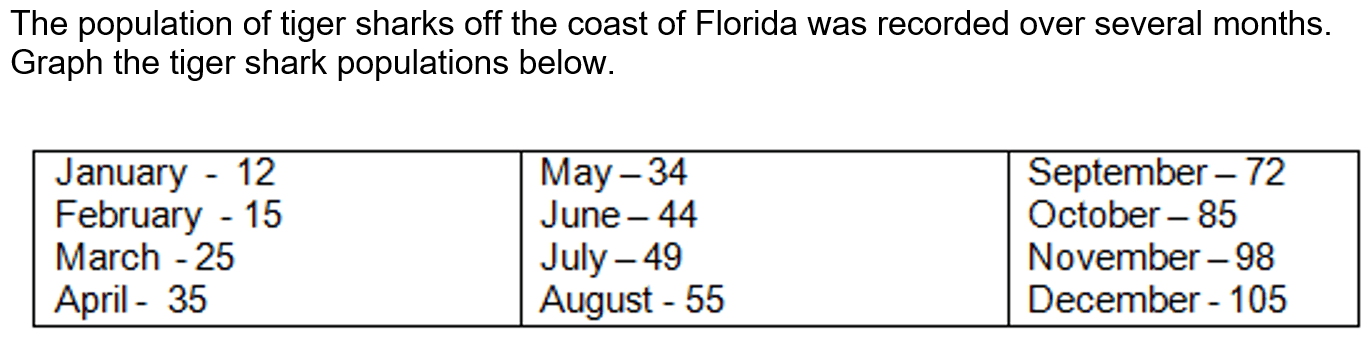
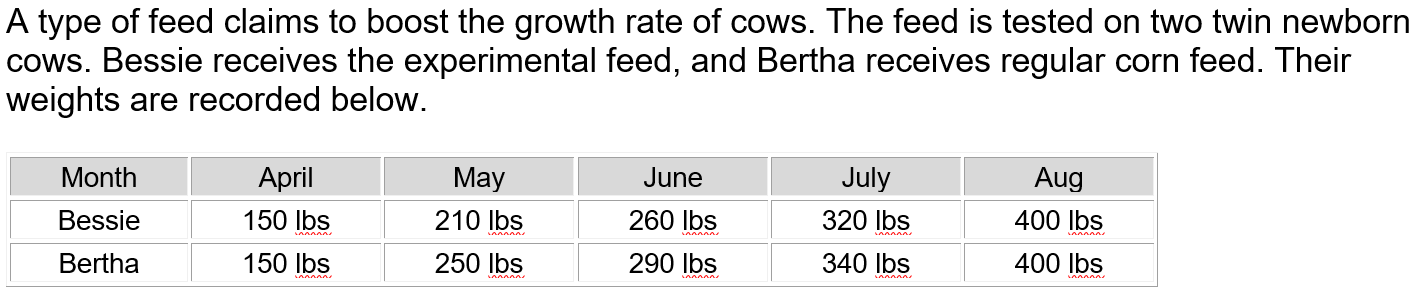
What is the Independent and Dependent variable based on the data collected?
Independent = Month
Dependent = number of sharks or shark populations
400
How many variables can be tested at the same time in one experiment?
1
500
A proposed explanation that has been tested several times, has a wide range of evidence, but can change is known as ___________.
Theory
500
I am trying to clean my bathroom shower because it has mold on the bottom. I was told to use Xtraclean to get the mold off. I use Xtraclean on half of the shower and water on the other half. What is the control group in this experiment?
half of the shower with only water
500
The "then" part of the hypothesis is the same as the _____ variable.
Dependent Variable
500
What are the essential elements of a graph?
Title
Labeling X axis and y axis
Key
500
Why must every experiment have a Control Group?
Bases of comparison. We need something to compare our tested results to.