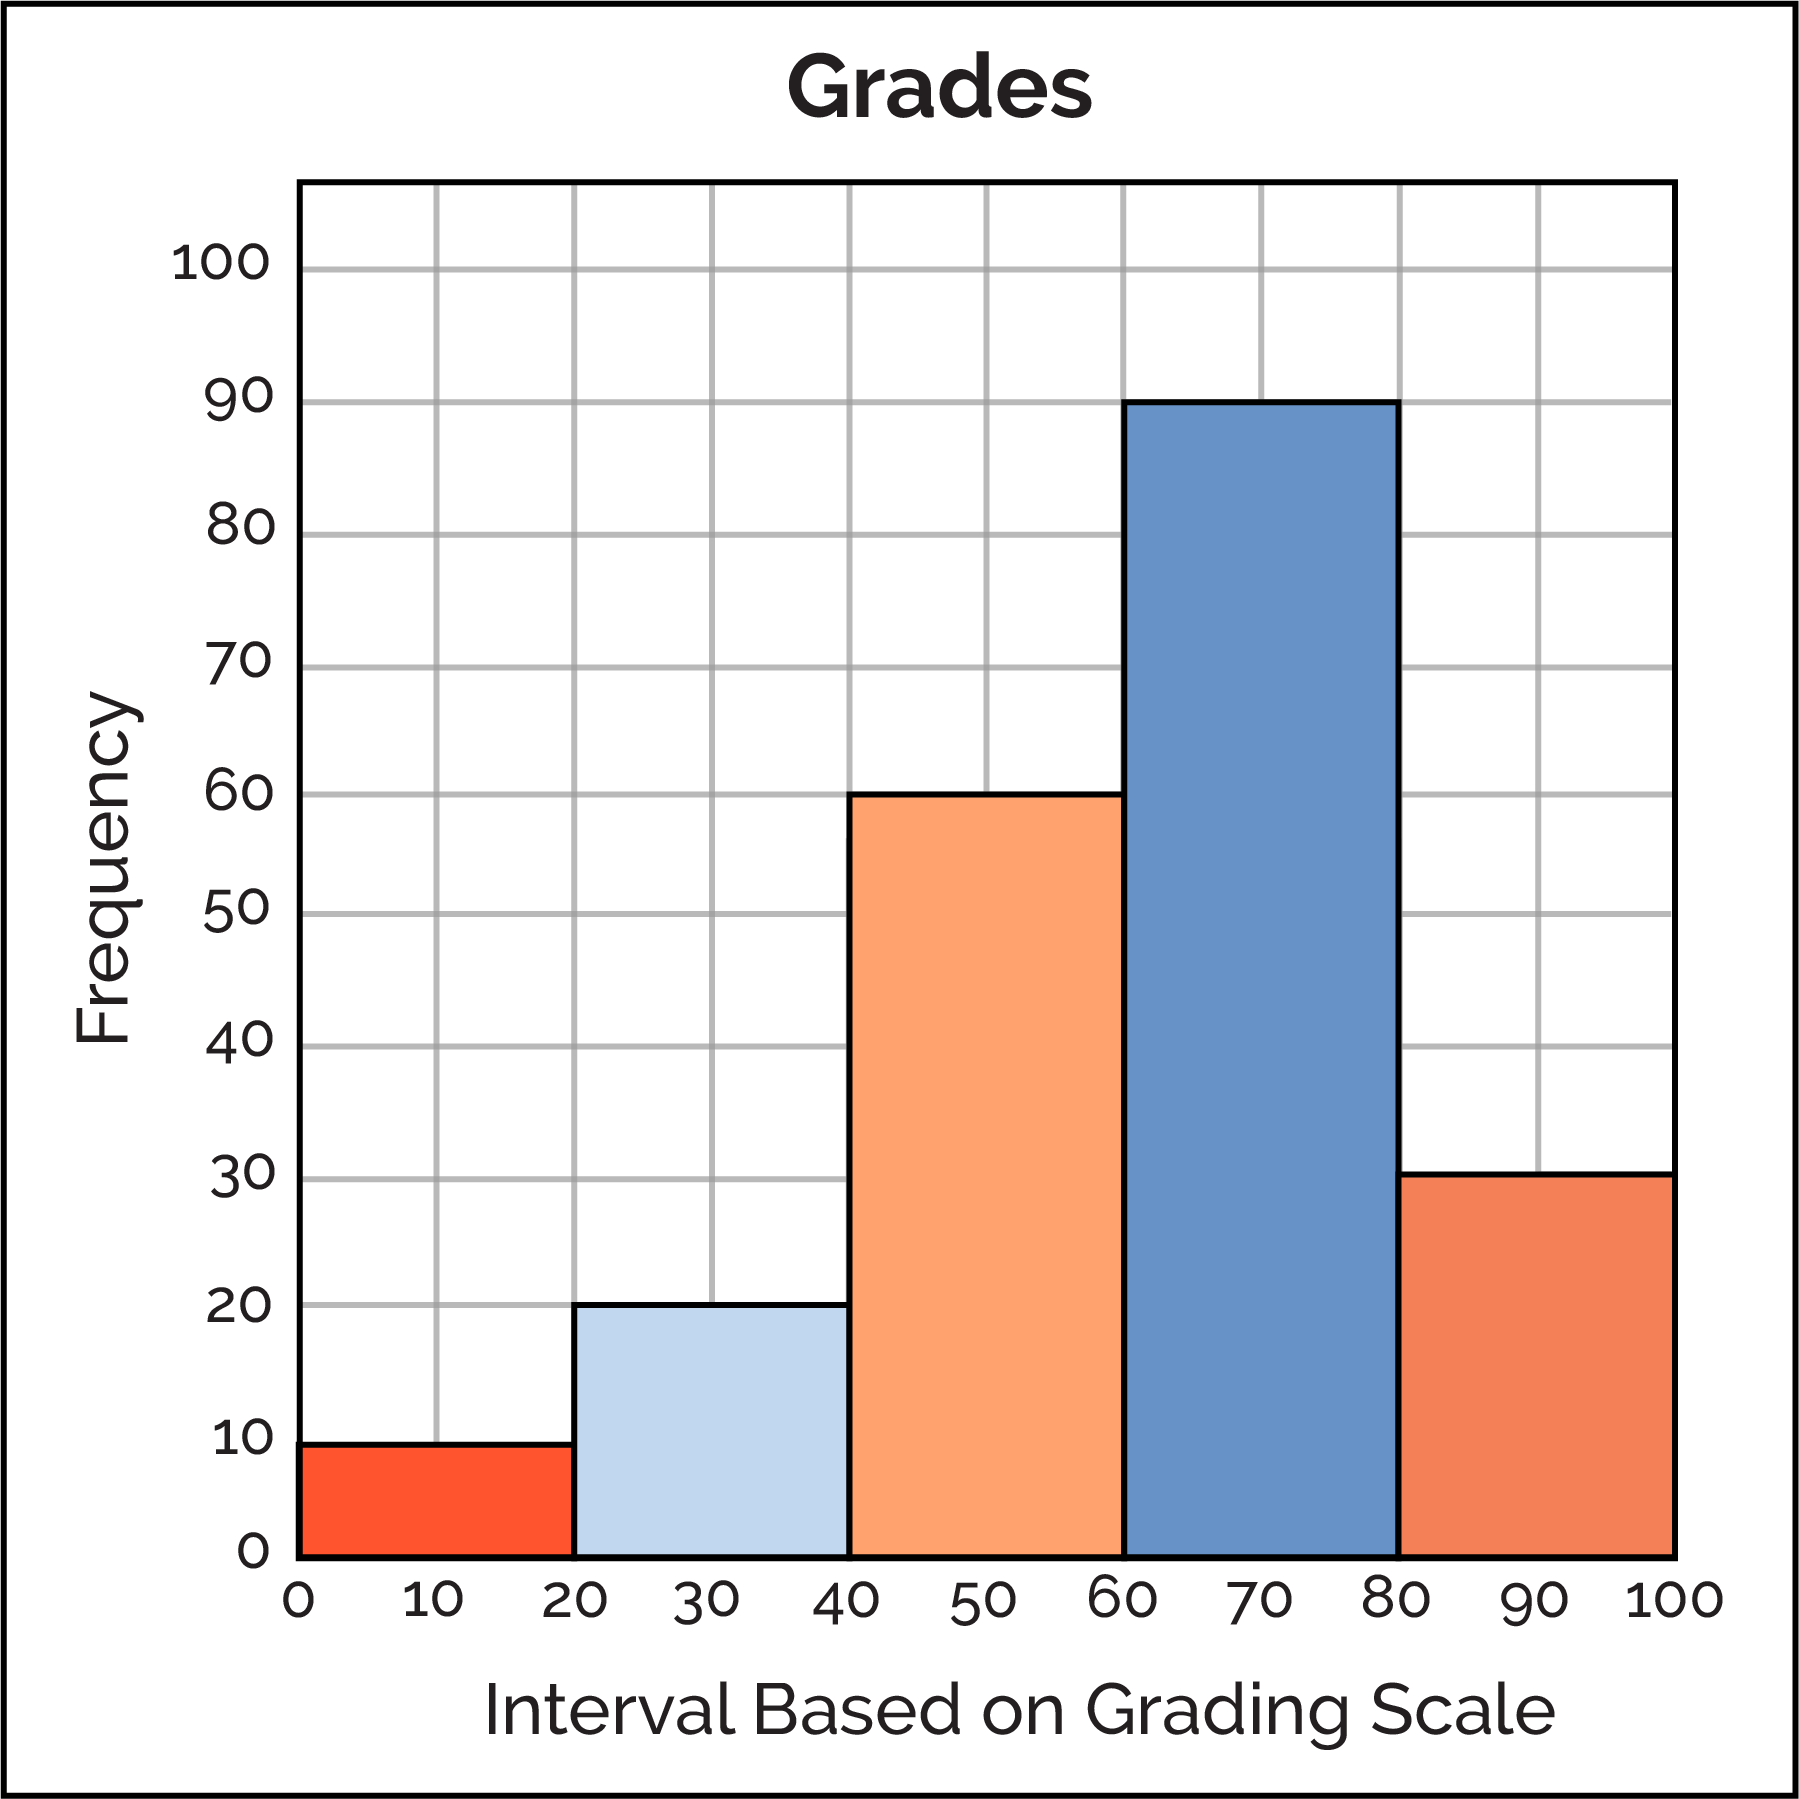
Histograms are different from bar charts because the x axis contains these, which is a range of numbers
What is an interval?
4 X 10^3 + 1 X 10^3
5 X 10^3
5.55 X 10^5 + 4.55 X 10^4
6.005 X 10^5
This is the most common range of grades received

What is 60 to 80%?
1.33 X 10^-5 + 1.66 X 10^-5
What is 2.99 X 10^-5
6.02 X 10^3 + 3.14 X 10^2
6.334 X 10^3
If a student scored a grade of 20% they would fail the assignment and end up in this column

What is the second column?
7.77 X 10^-3 - 5.55 X 10^-3
2.22 X 10^-3
7.73 X 10^5 - 5.3 X 10^4
7.2 X 10^5
This is the total number of students

What is 210 students?
2.5 X 10^42 + 8.5 X 10^42
1.1 X 10^43
8.41 X 10^-5 - 7.9 X 10^-7
8.331 X 10^-5
Convert to scientific notation: 1
What is 1 X 100
If a student had a score of 1.00 X 10² % they would end up in this column

What is the last column?
400 - 4.00 X 10^2
0
29.5 X 10^4 - 29,500,000 X 10^-2
0