Questioning
Tally Charts
Pictographs
Bar Graphs
Inferencing
100
Which one of the following questions requires the collection of data?
a- What color is the bird?
b- How do we see birds?
c- Are there birds on the tree?
d- Were there more blue or red birds in the tree?
Were there more blue or red birds in the tree?
100
How many kids chose extra recess?
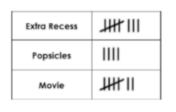
8 students
100
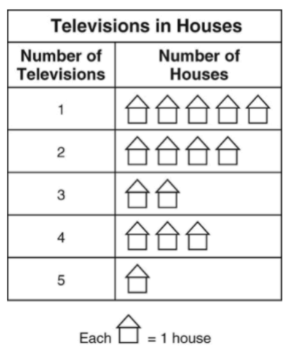
How many apples did Jordan pick?
🍎 = 2 apples
Mia: 🍎🍎🍎
Jordan: 🍎🍎
Lily: 🍎🍎🍎🍎
4 apples
100
What is the difference between a bar graph and a pictograph?
A pictograph has pictures, a bar graph uses bars
100
What inference can be made based on this tally chart?
Answers may vary based on data
200
Which one of the following questions requires the collection of data?
a- Would you like a class pet?
b- Do you like fish?
c- What kind of pets do you have at home?
d- Is a snake a pet?
What kind of pets do you have at home?
200
How many more kids like apples compared to grapes?
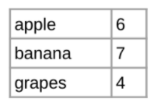
2 students
200
How many kids chose math over reading?
Subject Pictograph
Reading⭐ ⭐ ⭐
Math⭐ ⭐ ⭐ ⭐
Science⭐ ⭐
Art⭐ ⭐ ⭐
Each ⭐ = 5 students
5 students
200
How many kids chose basketball?
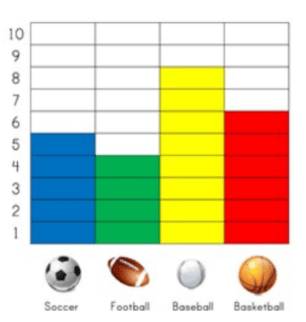
6 or 7 (hard to see)
200
Based on the graph, what is one inference that can be made?
Answers may vary
300
Which one of the following questions requires the collection of data?
a- Were there more sunny or cloudy days this month?
b- Are sunny days fun?
c- Are cloudy days fun?
d- Do you like sunny days?
Were there more sunny or cloudy days this month?
300
Using the tally chart, how many students were polled?
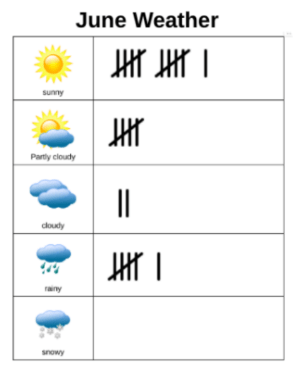
24 students
300
What was the most common pet?
Pet Pictograph
Dogs🐾 🐾 🐾 🐾
Cats🐾 🐾 🐾
Fish🐾 🐾 🐾 🐾 🐾
Birds🐾 🐾
Each 🐾 = 1 pet
Fish
300
How many pandas and elephants are at the zoo?
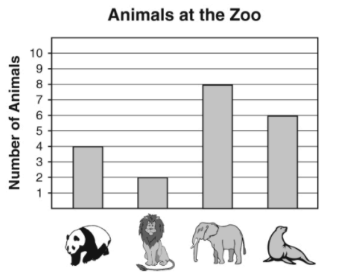
12
300
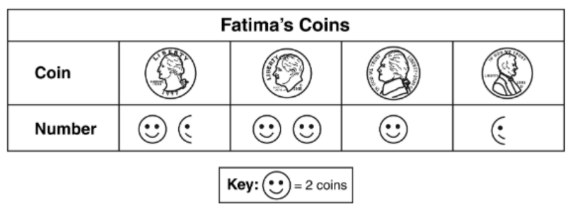
Based on the graph, what can you infer about the amount of dimes Fatima has compared to pennies?

Fatima has more dimes (4) than pennies (1).
400
Which question could be used as a survey question?
a- Is school important?
b- Is school fun?
c- How do you get to school (bus, car, walk)?
d- Why do we go to school?
c- How do you get to school (bus, car, walk)?
400
Vera flipped a coin 20 times. It landed on heads 10 times. Which tally chart shows her results?
1-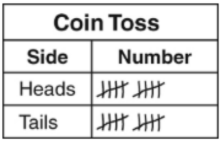 2-
2- 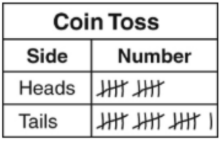
1- 
400
How many apples did Lily and Mia have combined?
🍎 = 2 apples
Mia: 🍎🍎🍎
Jordan: 🍎🍎
Lily: 🍎🍎🍎🍎
14 apples
400
How many kids were pulled?
20 students
400
What 2 questions can be answered based-on the graph?
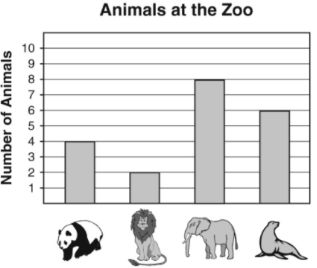
a- What animal is your favorite?
b- How many elephants are at the zoo?
c- How many animals are at the zoo?
d- What time does the panda exhibit close?
b- How many elephants are at the zoo?
c- How many animals are at the zoo?
500
What is the first step in creating a graph?
a- create a survey question
b- make a tally chart
c- draw a graph
d- create a key
a- create a survey question
500
Why are tally charts important?
They help us know how many people voted and how they voted.
500
How many kids voted?
Subject Pictograph
Reading⭐ ⭐ ⭐
Math⭐ ⭐ ⭐ ⭐
Science⭐ ⭐
Art⭐ ⭐ ⭐
Each ⭐ = 5 students
60 students
500
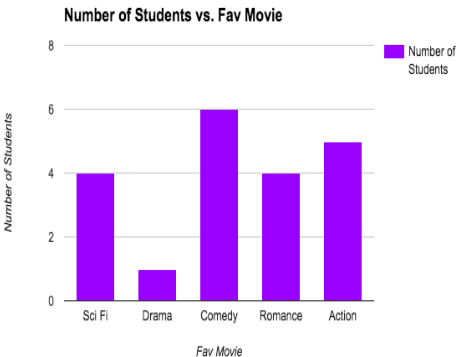
How many people chose comedy and sci-fi?

10 students
500
What 2 questions can be answered based-on the graph?
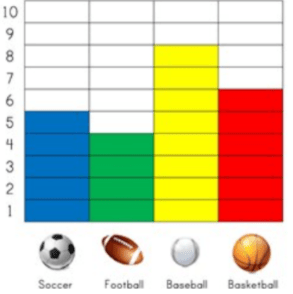
a- How many kids were polled?
b- What is your favorite sport?
c- How many students liked soccer over football?
d- What time does the basketball game start?
a- How many kids were polled?
c- How many students liked soccer over football?