R Studio
OLS Regression
Interpretation
Estimation
Miscellaneous
100
This general RStudio function allows us to view coefficients after running an OLS model:
summary(OLS)
100
This type of regression is used for multiple independent variables
Multivariate
100
This type of bias occurs when we exclude an important explanatory variable:
Omitted variable bias
100
This estimate is a show for the amount of accounted for variance within the model. Also is the tell for how well the fit is for the mdel:
R2 Value
100
When changes in the independent variable are correlated with the error term:
Endogeneity
200
This option is used to see the full notation of numbers:
options(scipen=X)
200
This type of transformation is used to compare coefficients of variables measured on difference scales:
Standardize
200
This type of variable is set to one of two possible values (either 1 or 0) representing what group an observation belonged:
Dummy Variable
200
This type of test compares the mean of Y for one group against the mean of Y for another group:
Difference of means test
200
This type of model imposes the relationship implied by
the null hypothesis on the unrestricted model:
Restricted model
300
This library package that contains the function used to calculate VIFs within R:
library(car)
300
In order for a model to be non-linear the X variables must be ____:
Squared, cubed, logged, etc.
300
This type of transformation allows us to estimate models in which the coefficients reflect percentage rather than absolute changes:
Log
300
RStudio uses a staring system to show the significance of this estimation
P-Value
300
This part of the regression captures everything else other than X that affects Y.
Error Term
400
Library package that enables the describe function within RStudio:
library(psych)
400
A polynomial model includes X variables with what kind of transformation:
Power greater than 1
400
What is the final rejection rule where the P-value is lower than the estimated critical value:
Reject the null hypothesis
400
Equation used to manually calculate a VIF:
1 / (1 - R2)
400
Occurs when an analyst changes the model until
their desired results are achieved:
Model Phishing
500
What would the line of code look like if we wanted to create a bivariate regression, where the data frame was names "OLS1":
OLS1<- lm(Y ~ X)
500
This type of transformation allows us to estimate models in which the coefficients reflect percentage rather than absolute changes:
Log
500
An OLS model has a R2 value of .954, what does this mean:
Roughly 95% of variance is able to be estimated from the model
500
Equation used to calculate the F-Statistic for an F-Test:
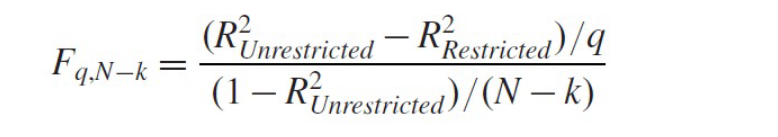
500
Occurs when two or more independent variables are linearly correlated in a regression model:
Multicollinearity