Maps & Geographic Tools
Rainforests & the Environment
Interpreting Data & Graphs
Canada & Regions
Immigration, Push and Pull Factors
100
Cardinal directions include
A. north, east, south, west
B. latitude, longitude, equator, prime meridian
C. mountains, plains, plateaus, hills
D. districts, countries, continents, oceans
A. north, east, south, west
100
Biodiversity refers to
A. economic growth in a region
B. the variety of plant and animal life in an area
C. differences between countries
D. levels of rainfall
B. the variety of plant and animal life in an area
100
A map key is important because it
A. lists the scale of the map
B. explains the symbols used
C. shows directions
D. gives relative locations only
B. explains the symbols used
100
The Prairie Provinces are known for producing
A. grain and cattle
B. gold and diamonds
C. coal and oil
D. maple syrup
A. grain and cattle
100
A pull factor is best described as
A. a threat or danger
B. something appealing that draws people in
C. a natural disaster
D. a type of economy
B. something appealing that draws people in
200
Which type of map shows natural features like mountains and rivers?
A. political map
B. thematic map
C. physical map
D. climate map
C. physical map
200
Rainforests help regulate Earth’s climate by
A. releasing large amounts of oxygen
B. blocking hurricanes
C. changing ocean temperatures
D. increasing deserts
A. releasing large amounts of oxygen
200
A bar graph is useful for comparing
A. continents
B. data categories
C. weather patterns
D. latitude and longitude
B. data categories
200
The economic activity most common in Canada’s Northern Region is
A. manufacturing
B. farming
C. mining
D. fishing
C. mining
200
A push factor is best described as
A. something that makes people leave a place
B. something that attracts people to a place
C. a type of transportation
D. a type of government
A. something that makes people leave a place
300
Lines that measure distance north or south of the equator are called
A. meridians
B. parallels
C. coordinates
D. continents
B. parallels
300
Deforestation in the Amazon mainly occurs because of
A. space exploration
B. logging and cattle ranching
C. ocean pollution
D. volcanoes
B. logging and cattle ranching
300
A line graph is best used to show
A. changes over time
B. distribution of rainfall
C. national boundaries
D. elevation of land
A. changes over time
300
Most people in Canada live near
A. the Pacific coast
B. the U.S. border
C. the Arctic Ocean
D. the Rocky Mountains
B. the U.S. border
300
All of the following are major push factors except
A. hunger
B. poverty
C. violent conflict
D. economic opportunity
D. economic opportunity
400
What does the relative location of a place tell you?
A. the longitude and latitude of a place
B. which symbol shows a place on a map
C. where a place is compared to another place
D. the map projection being used
C. where a place is compared to another place
400
Which of these do environmental groups in the Amazon most want to protect?
A. biodiversity
B. ecotourism
C. deforestation
D. wetlands
A. biodiversity
400
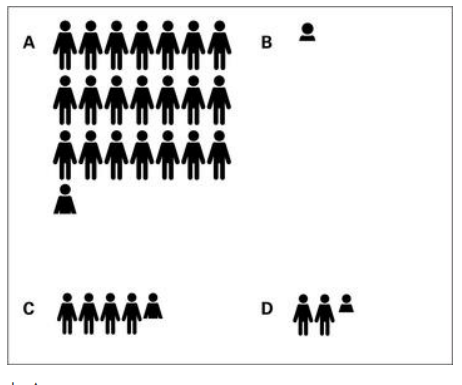
Each person below represents one million people. Which graph represents the population of Canada’s Core Region?
A. Graph A
B. Graph B
C. Graph C
D. Graph D
A. Graph A
400

Each person below represents one million people. Which graph represents the population of Canada’s Core Region?
A. Graph A
B. Graph B
C. Graph C
D. Graph D
A. Graph A
400
Which of the following is not a major pull factor drawing people to the United States?
A. family
B. schools
C. freedom
D. drought
D. drought
500
Which of the following tell you exactly where a place is located?
A. geographic coordinates
B. cardinal directions
C. parallels of latitude
D. meridians of longitude
A. geographic coordinates
500
Rainforests are called the “lungs of the Earth” because of their role in
A. the food web
B. the Coriolis effect
C. the El Niño current
D. the carbon-oxygen cycle
D. the carbon-oxygen cycle
500
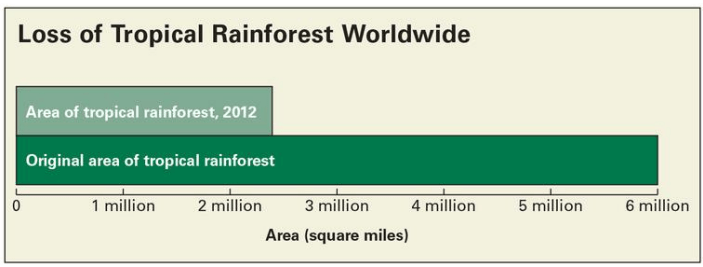
Which statement is best supported by the graph?
A. Rainforest loss has increased in the past 10 years
B. More than half of the world’s rainforests have been lost
C. Rainforests once covered about 3 million square miles
D. Two-thirds of the world’s rainforests have disappeared
B. More than half of the world’s rainforests have been lost
500
Which of these is the main reason why so few people live in Canada’s Northern Region?
A. dense forests
B. few resources
C. far from other places
D. rugged mountains
B. few resources
500
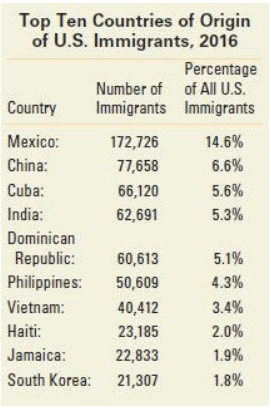
Which of these statements about immigration to the United States in 2016 is best supported by the table below?
a. China had a larger brain drain to the U.S. than any other country.
b. Mexico lost more than 150,000 people to the United States.
c. More political refugees came to the U.S. from Colombia than from any other country.
d. More newcomers from India later returned to their homeland than immigrants from any other country.
b. Mexico lost more than 150,000 people to the United States.