Graphs
Maps
Diagram
Charts
And all the Rest
100
 These items represent examples of -
A. ? ethnic bias
B. ? domestic production
C.? religious diversity
D.? cultural diffusion
D.cultural diffusion
100
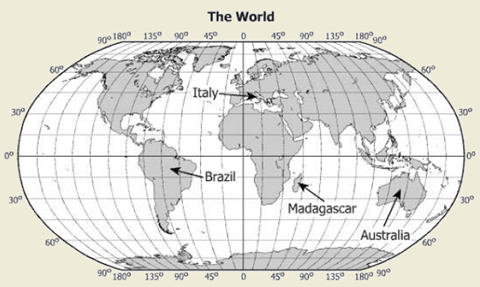
Which country contains the latitude and longitude 15°S, 45°W?
- ? Brazil
- ? Italy
- ? Madagascar
- ? Australia
A. Brazil
100

The information shown in this diagram led to the expansion of -
A. ? rural areas
B. ? family farms
C. ? suburbs
D. ? canals
C. ? suburbs
100

Which activity best completes this table?
A.? Banking
B.? Canning
C.? Fishing
D.? Ranching
A.? Banking
100
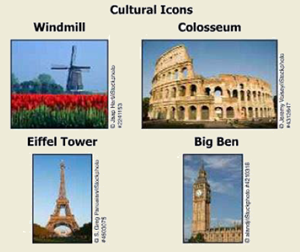
These structures are associated with the continent of-
A. ? North America
B. ? Australia
C. ? Europe
D. ? South America
C. Europe
200
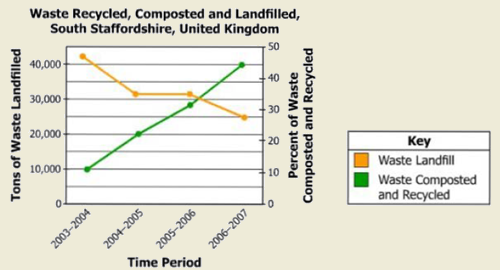
Which statement Is best supported by this graph?
A. The amount of waste in landfills increased.
B. People became more involved in recycling.
C. The amount of waste composted decreased.
D. Government funding was reduced for recycling.
B. People became more involved in recycling.
200
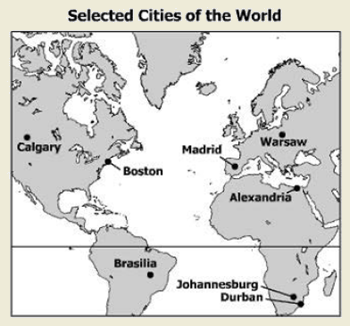
Which two cities have opposite seasons?
A. Boston and Madrid
B. Warsaw and Alexandria
C. Calgary and Durban
D. Johannesburg and Brasilia
C. Calgary and Durban
200

Which characteristic best replaces the question mark?
A. ? Expanded regional trade
B.? Greater career opportunities
C. ? Increased air pollution
D. ? More cultural centers
C. Increased air pollution
200

One reason some companies choose to participate in this practice is the-
A.? lack of essential services
B. ? opportunity to lower production costs
C. ? need to establish labor unions
D. ? support for new technologies
B. opportunity to lower production costs
200

Which phrase best completes the title of this list?
A. ? Public Education
B.? Religious Beliefs
C. ? Official Languages
D. ? Population Distribution
D. ? Population Distribution
300
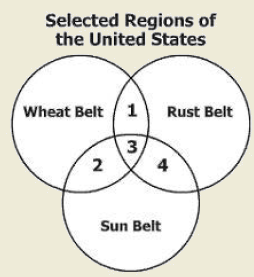
Which description is matched with the correct section of this diagram?
A. Section 1 represents economic regions.
B. Section 2 represents political regions.
C. Section 3 represents ethnic regions.
D. Section 4 represents climate regions.
A. Section 1 represents economic regions.
300
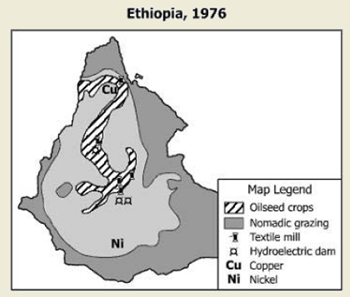
On this map, industrial activity is represented by -
A. shades
B. lines
C. symbols
D. letters
C. Symbols
300

Which advantage best completes this diagram?
A.? Limited foreign regulations
B.? Reduced reliance on foreign trade
C. ? Increased global influence
D. ? Similarity of government systems
C. ? Increased global influence
300
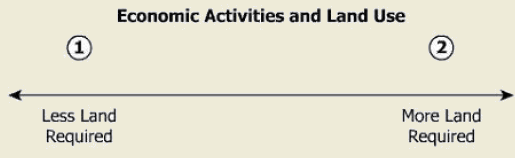
Which economic activity is correctly placed on this diagram?
A.? Banking in 1
B.? Ranching in 1
C. ? Shopping in 2
D. ? Manufacturing in 2
A.? Banking in 1
300
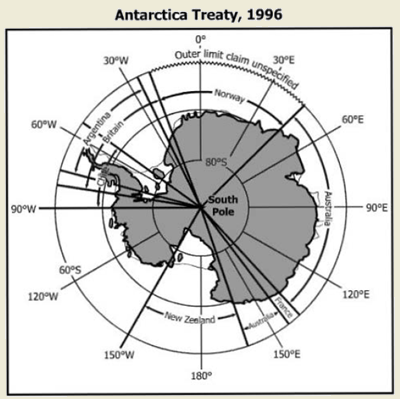
According to this map, which country does NOT have a territorial claim to Antarctica?
A. ? Britain
B ? France
C. ? Norway
D ? China
D ? China
400
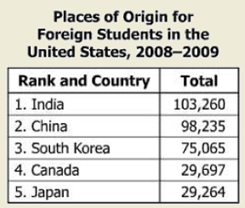
Which conclusion can be drawn from this table?
A. Educational opportunities in the United States are a push factor.
B. Most foreign educations are superior to those in the United States.
C. Educational opportunity pulls Asian students to the United States.
D. Most foreign students in the United States are European.
C. Educational opportunity pulls Asian students to the United States.
400
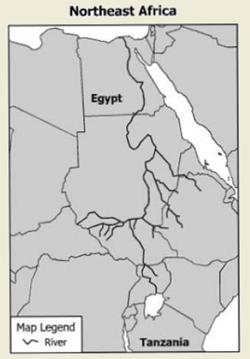
Which major river system is shown on this map?
A. Indus
B. Nile
C. Amazon
D. Danube
B. Nile
400

Which phrase best completes this diagram?
A.? Manual labor
B. ? Limited communication
C. ? Diverse economy
D.? Specialized production
D. Specialized production
400
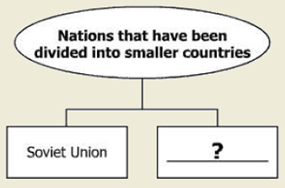
Which country best completes this diagram?
A. ? Mexico
B ? Yugoslavia
C.? Portugal
D. ? Chile
B ? Yugoslavia
400
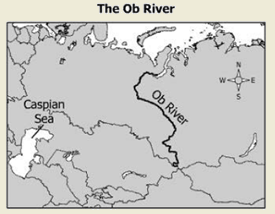
This river flows northward into the--
A. ? Pacific Ocean
B. ? Indian Ocean
C. ? Arctic Ocean
D ? Atlantic Ocean
C. ? Arctic Ocean
500
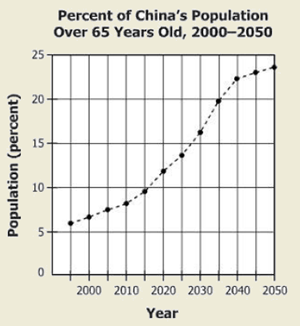
Which change to China's population between 2000 and 2050 does this graph project?
A. China's total population will decrease.
B. China's overall birthrate is expected to increase.
C. Less than half of China's population will be under the age of 65.
D. The number of Chinese people over the age of 65 will increase.
D. The number of Chinese people over the age of 65 will increase.
500
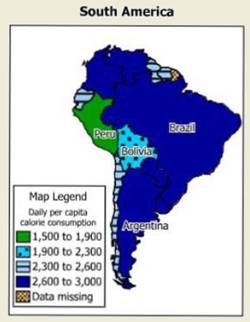
This map supports the conclusion that malnutrition is most likely to occur in which country?
A. Peru
B. Brazil
C. Bolivia
D. Argentina
A. Peru
500
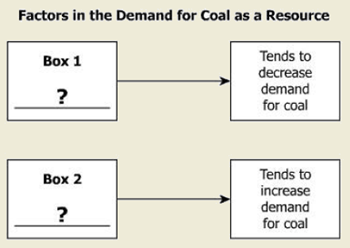
Which factor Is matched with the correct box?
A. ? Environmental Concerns in Box 1
B. ? Population Growth in Box 1
C. ? Agricultural Output in Box 2
D. ? Medical Innovation in Box 2
A. Environmental Concerns in Box 1
500
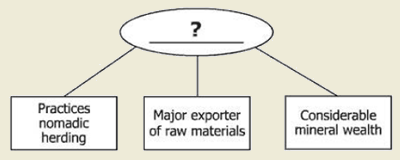
Which geographic region best completes this diagram?
A. ? North America
B. ? Sub-Saharan Africa
C. ? Western Europe
D. ? Southeast Asia
B. ? Sub-Saharan Africa
500
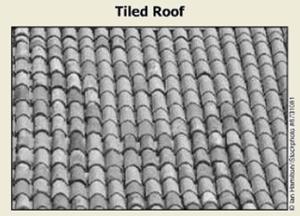
In which region is this type of roof most commonly used?
A. ? Canadian Shield
B. ? Northern Mongolia
C. ? Mediterranean
D ? Scandinavia
C. ? Mediterranean