Analyze This
Its not FEMA its FMEA
Dist-urb-utions
Feeling like a Scientist
Staying in Control
100
This tool is used to reduce problems arising from poor housekeeping or organization.
5S
100
This tool is used to predict what could happen if something goes wrong in a process.
FMEA
100
"The mean of the sampling distribution of means is equal to the mean of the population" describes this type of distribution.
Normal Distribution
100
The null hypothesis is rejected when it is true is an example of this type of error.
Type 1 Error
100
This is a Japanese term that means gradual, unending improvement by doing little things better and setting and achieving increasingly higher standards.
Kaizen
200
This is another term used for process mapping.
Process flowcharting
200
These three scales are used to calculate the RPN.
Severity, occurrence, detection
200
You would describe the shape of the below distribution as this. 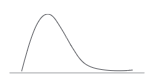
Positive skewed
200
H0 : μ = 0; H1 : μ ≠ 0 is an example of what type of hypothesis test.
Two tailed test
200
This group is critical to improvements following Kaizen.
Front line employees
300
These two types of steps make up a value analysis or process.
Value and non value added
300
These are the two types of FMEA
Design, Process
300
A binomial distribution is used to model this type of data.
Discrete data
300
This is what is determined by hypothesis testing (what we are trying to prove).
Whether we can reject or not reject the null hypothesis.
300
In this stage of the PDCA cycle is a plan implemented on a trial basis.
Do Stage
400
This is a good tool for prioritizing the potential root causes of a problem.
Matrix diagram
400
These are the two most critical aspects to FMEA success.
FMEA involvement and leadership buy in
400
A system is considered in control when this type of variation is not present.
Special Cause Variation
400
For the below problem this would be the null hypothesis.
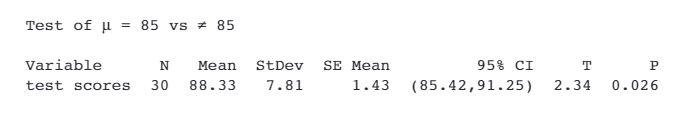
Ho: u=85
400
This is a step-by-step description of how to complete a task.
Standard Operating Procedure (SOP), or Standard Work
500
These pieces of information differentiate a process map from a process flow chart.
Detailed information about the process including costs, setup time, cycle time, inventory, types of defects that can occur, probability of defects.
500
At a high level these are the primary steps in FMEA development.
Review the process
Brainstorm failure modes
Assign severity rating
List causes
Assign occurrence rating
Identify controls
Assign detection rating
Calculate RPN
500
A large hospital identified a decline in safety scores across three locations. After engaging in root cause analysis, the project team discovered there was only one hospital with low scores, which were impacting the other two hospitals. The project team believed there was a strong positive relationship between safety scores and the length of time spent in safety training.
Which statistic provides evidence that time spent in training is a driver of safety scores
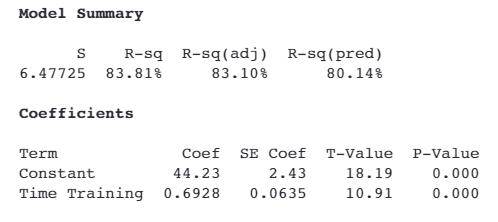
P value less than .005
500
For the below problem what would you conclude for this test.
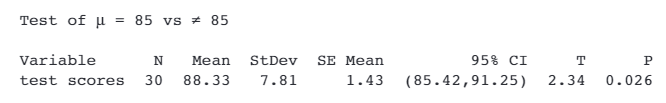
Reject the null hypothesis
500
This type of variation is displayed in the following individuals chart.
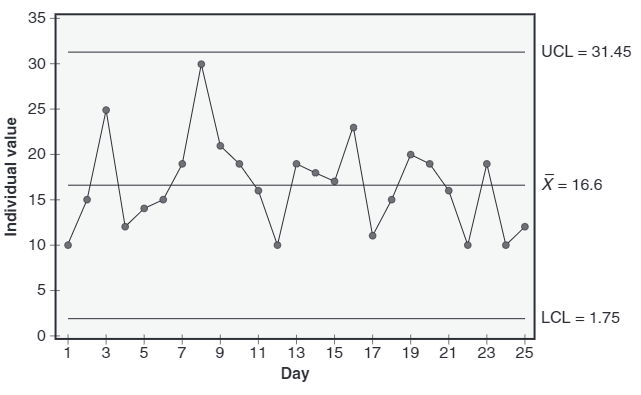
Common Cause Variation