Samples
Graphs
Experiments
100
How can you reduce sampling variability between different samples?
Use larger sample sizes
100
What are some key points to look at to ensure a graph is credible?
1. Check is axes are calibrated
2. Consider the source
3. Consider the sample size
4. Consider method of data collection (voluntary response sample, etc.)
100
The group in an experiment that receives no treatment is called:
The Control Group
200
A researcher wants to explore how smoking habits relate to depression. She has a group of self-described smokers take a survey and assign a numerical value to describe their level of depression. The survey also asks participants to record their heights, weights, and ages. Similarly, she has a group of self-described non-smokers take the same survey. In this study, level of depression, height, weight, and age are called:
Variables
200
Why might the following poll give unreliable information?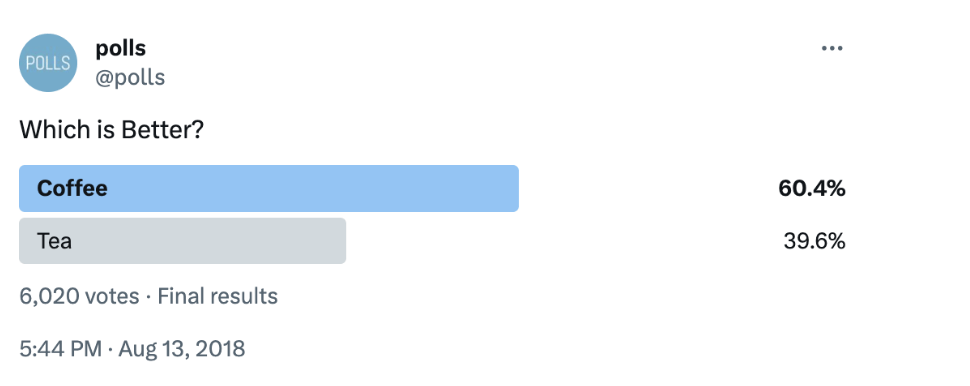
Voluntary Response Error (nature of an online poll)
Low Response Rate
200
A study tests whether drinking coffee improves reaction time. One group drinks coffee, and the other drinks water. The researchers measure how quickly participants press a button after seeing a light. What are the explanatory and response variables in this experiment?
The explanatory variable is whether participants drink coffee or water. The response variable is reaction time.
300
During a survey conducted to understand the dietary habits of a community, respondents were asked to recall and report the types and amounts of food they consumed over the past month. However, many respondents had difficulty accurately recalling their dietary habits. What kind of error does this scenario generate in the survey?
Response Error
300
Analyze the graph: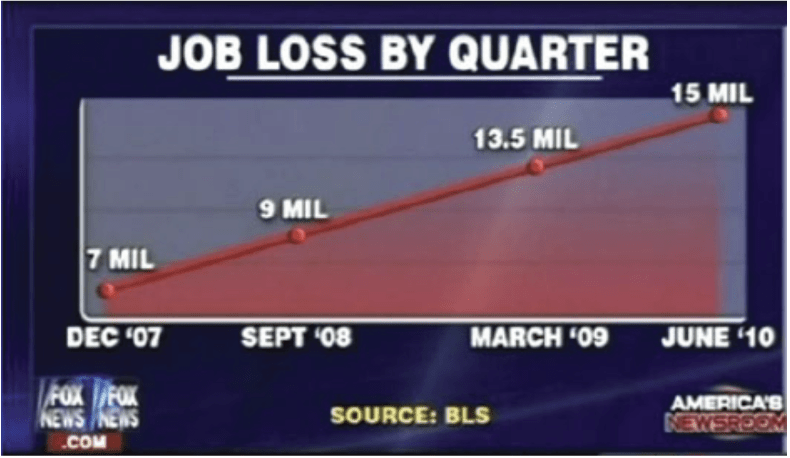
No y-axis, doesn't start at 0
No specifications of what constitutes "job loss"
300
A school compares students' performance in math before and after using a new online learning tool, but doesn’t account for changes in the math curriculum during the year. What’s the issue with this experiment?
Lurking variable: Changes in the math curriculum could influence the students' performance, making it unclear whether the learning tool or the new curriculum caused the improvement.
400
Comment on the following question as a potential sample survey question}: “Considering the alarming rates of obesity and the proven health risks associated with processed foods, do you believe that implementing stricter regulations on fast food restaurants is a necessary measure to safeguard the public health and well-being of our society?”
Biased wording: "alarming rates", "proven health risks", "safeguard public health and well-being"
400
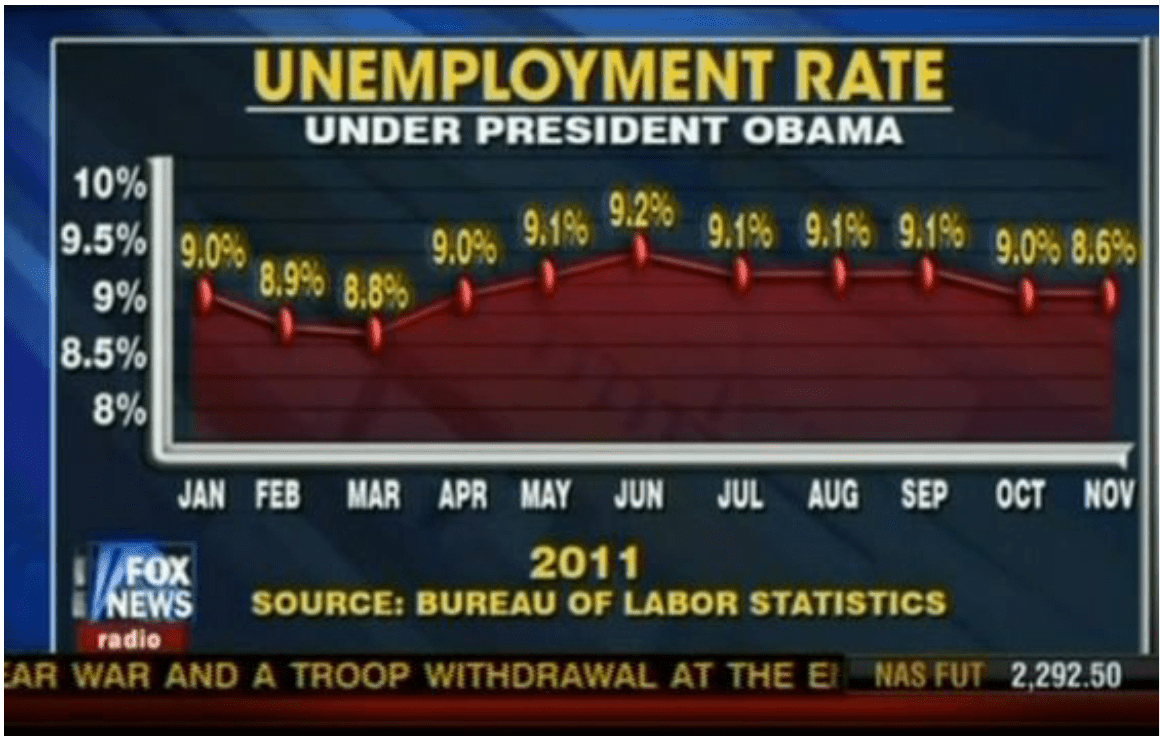
-y-axis not calibrated
-9.0% and 8.6% are shown to be equivalent
- 8.8 and 8.9 in Feb and Mar lower than Oct and Nov
400
A pharmaceutical company tests a new headache medication. One group receives the actual medication, while the control group receives no treatment at all. What is the flaw in this experimental design?
The lack of a placebo. Without a placebo, it’s impossible to know if any difference in headache relief is due to the medication itself or simply the belief that they are receiving treatment (the placebo effect). A placebo should be given to the control group to properly compare results.
500
A marketing report claims that a company’s social media campaign was more successful because it gained 10,000 followers in a month, compared to a competitor who gained only 5,000. However, the competitor started with 2,000 followers, and the company started with 100,000. What is the flaw in this comparison?
Improper Comparison: The comparison is flawed because the two companies started with vastly different numbers of followers, making the absolute follower gain a misleading metric.
500

Both the x-axis and y-axis have been manipulated, which is very common on graphs like this.
Instead of starting using a consistent scale on the y-axis of this graph, they jump from 0 to 5,000 and the to 20,000. On the x-axis, the number of days between each important date are inconsistent as well.

500
A university wants to test whether a new study app improves students' exam scores. Design an experiment to test the effectiveness of the app.
Randomly assign students to two groups. One group will use the new study app, while the other group will not. Both groups should be given the same amount of study time and access to similar materials (except the app). After a set period, compare the exam scores (the response variable) of both groups. Ensure that all other factors, like exam difficulty and testing conditions, are kept the same to isolate the effect of the study app.