Probability Distributions
Easy Probability Distributions
Normal Distribution
Central Limit Theorem
Confidence Intervals
100
The Binomial distributions is a ________________ distribution while the normal distribution is a _____________ distribution.
100
f(x)=1/25 for 0<=x<=25
A probability distribution represented by this function is called a ________________ distribution because it graphs like a ____________________ ______________.
uniform, horizontal line
100
A random variable is distributed uniformly between 6 and 13. What is the probability that x is at most 10?
4/7
100
A population has an unknown distribution with mean 99.6 and standard deviation 35.1. If you draw samples of size 417.
a. what is the mean of the sample means, what is the standard deviation of the sample means?
b. What value of x represents the 70% percentile for the sampling distribution?
a. 99.6, 1.72
b. 100.5
100
I want to be 90% confident that I estimate the mean of the population within 2.5. If the standard deviation of the population is 79.8, what sample size should I use?
n = 2758
200
In a discrete probability distribution P(x=6) might be equal to 0.00234, but in a continuous distribution, P(x=6) = ____________
0
200
f(x)=1/25 for 0<=x<=25
For the probability density function given above, what is P(2<x<12)?
2/5 = 0.4
200
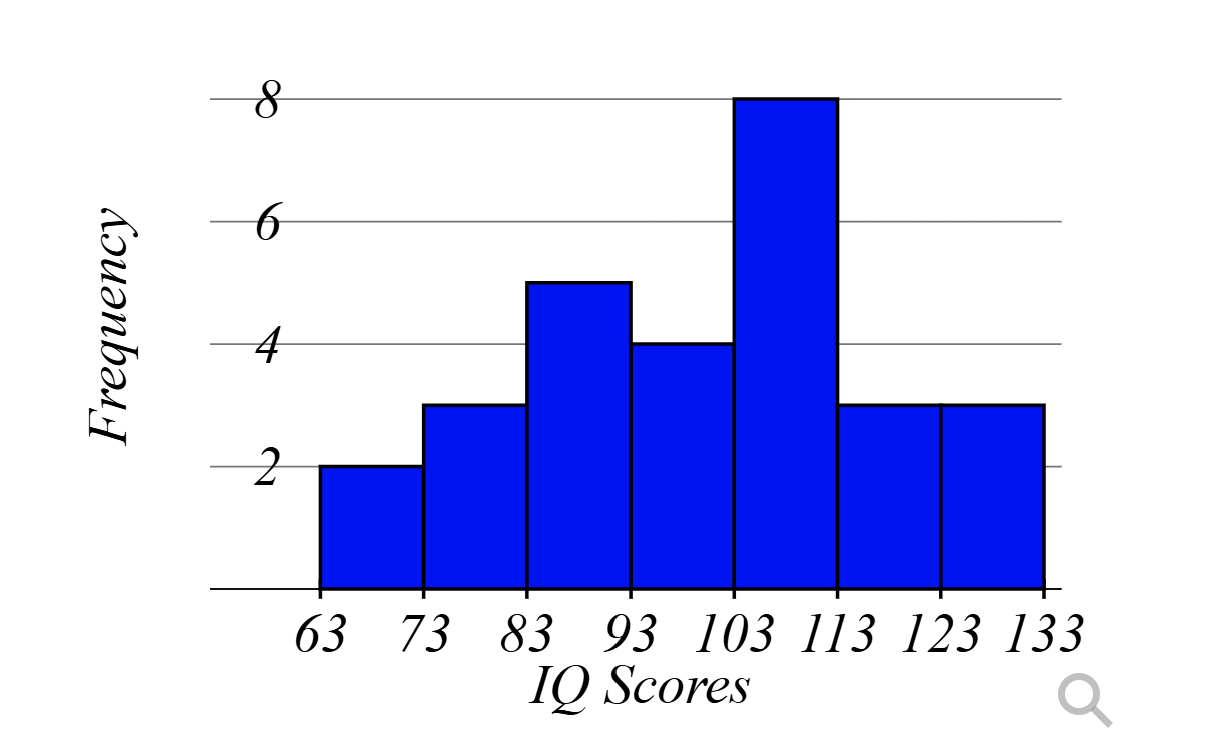
P(63 < X < 103) =
1/2
200
If you are using the central limit theorem for means with sample sizes of ___________ it is not necessary to assume the population is normally distributed.
greater than or equal to 30
200
Find a 95% confidence interval for sample size n = 81, sample mean 9.76 and population standard deviation of 13.5.
(6.62, 12.70)
300
In discrete probability distributions the probabilities are calculated for distinct x values and then summed if necessary, while in continuous probability distributions, the probabilities are calculated as _____________ under the _________________ ______________ _____________________.
area, probability density function
300
f(x)=1/25 for 0<=x<=25
For the probability density function given above, what is the mean? And why does this make sense?
The mean is 12.5 because the area to the left of that is 0.5 and the area to the right of it is 0.5.
300
X~N(123, 10) What is the z-score for x = 139?
1.6
300
X~N(161.7, 16.4)
a. What is the probability that a single random value is selected and it is greater than 160.1.
b. What is the probability that I draw a sample of size 177 and the mean is greater than 160.1?
a. 0.5389
b. 0.9029
300
All else equal, an increase in sample size will cause an (increase or decrease) of the confidence interval?
decrease
400
What does the shaded area in the normal distribution function below represent?

The probability that an individual value of the random variable will be between 24 and 27 if the mean of the distribution is 26 and the standard deviation is 3.2.
400
f(x)=1/25 for 0<=x<=25
For the probability density function given above, what is the 30% percentile?
7.5
400
X~N(1400, 130) where X represents the price paid for a t.v. what percentage of t.v.s cost between $1010 and $1400?
49.85%
400
It is estimated that 25% of adults work from home. If an employment agency randomly samples 450 adults:
a. what is the mean and standard deviation of the sampling distribution?
b. What is the probability that fewer than 24% of the sample work from home?
a. 0.25, 0.0204
b. 0.3121
400
I want to estimate the mean temperature. I have a sample of: 47.9, 37.3, 23, 44.6, 47.6, 43.6, 41.3.
If the population is normally distributed, find a 99% confidence interval for the population mean. I am using the __________________________ distribution.
(28.65, 52.87), Student T
500
In a discrete probability distribution the outcome is counted but in a continuous probability distribution the outcome is ________________. The area under the distribution is always equal to ________,
measured, 1
500
f(x)=1/25 for 0<=x<=25
For the probability density function given above, what is P(x > 12 | x > 6)?
13/19
500
The empirical rule says that ________% of the data falls within 2 standard deviations of the mean.
95
500
A study shows 3.5% of the general population lives past their 90th birthday. In a graduating class of 730 students, what is the probability that 27 or less will live beyond their 90th birthday?
0.6517
500
Insurance companies want to know the proportion of people who buckle up. A random sample of 393 drivers showed 315 buckled up. Create an 89% confidence interval for the population proportion.
(0.769, 0.834)