Significance Tests
Significance Tests (Word Problems)
Confidence Intervals
Probability
Midterm Refresher
100
null: 𝛍= 75, alternative: 𝛍>75, N: 50, 𝛍_samp: 77.1, 𝛔: 6.4, 𝛂: 0.01, is it significant?
p=0.010165189, so it is NOT statistically significant
100
79 out of 144 state senators polled say they would vote in favor of a balanced budget amendment for their state. Is there evidence that, if brought to a vote, the amendment would receive majority support?
H0 : p = 0.50
Ha : p > 0.50
P ≈ 0.1218.
There is no evidence of a statistically significant majority of support for the amendment.
100
The mean height of adult American males in 1912 was around 68.3 inches. A random sample of 11 adult men in 2015 yields a mean height of 69.7 inches with standard deviation of 2.4 inches.
Find a 98% confidence interval for the mean height of adult American males in 2015.
Confidence Interval=xˉ±Margin of Error
(67.7, 71.7)
100
A biased coin has a probability of landing heads (success) of 0.65. Let X be a Bernoulli random variable representing the outcome of a single flip, where X=1 for heads and X=0 for tails. What is P(X=0)?
0.35
100
Give the 5-number summary for the following data:
46, 32, 39, 44, 41, 48, 52, 38, 33, 40, 51, 49, 48, 55
Minimum: 32
First Quartile (Q1): 38.75
Median (Q2): 45
Third Quartile (Q3): 49.5
Maximum: 55
200
null: p=0.5, alternative: p=/=0.5, Successes: 102, Failures: 93, 𝛂=0.025. List the standard error, test statistic, p-value, and whether it is significant.
SE: 0.035806, Test Statistic: Z=0.6445, P-value: 0.5208, so it is not significant
200
A nutritionist wants to test if a new high-protein diet affects the average weight loss after 4 weeks. From previous data, the average weight loss for people not on the diet is known to be 5 pounds. A random sample of 9 individuals tries the new diet for 4 weeks, and their average weight loss is 6.2 pounds with a sample standard deviation of 1.5 pounds.
At the 5% significance level, is there enough evidence to conclude that the new diet leads to a different average weight loss?
p-value=2⋅P(T>2.4)≈2⋅0.021=0.042
Reject the Null Hypothesis
200
The sample values {13.3, 14.2, 16.1, 13.5, 11.7} are drawn from a population.
Construct a 95% confidence interval for the mean of the population.
[11.779, 15.741]
200
Suppose Y is a binomial random variable with parameters p = .23 and N = 25. What is P{Y = 14}
0.000291521
200
If you have 1002 data points, how many buckets would you use for a histogram?
10 buckets
300
null: p1-p2=0, alternative: p1-p2 >0, p-hat1= 0.76, p-hat2= 0.69, N1= 100, N2= 107, 𝛂=0.01. Give the test statistic, p-value, and whether it is significant
Test statistic= z=1.1237, p-value= 0.1301, not statistically significant (fail to reject the null)
300
A survey consists of random-digit dialing of telephone numbers belonging to drivers in California. The surveyors ask the 510 individuals who respond, “Recalling the last ten traffic lights you drove through, how many of them were red when you drove through the intersection?” 138 admit that at least one of the lights had been red. Safety studies indicate that if more than one out of every four drivers drives through a red light, there will be a jump in traffic collisions. Is there evidence that there will be a jump in traffic collisions ( alpha =.05)? Show all steps in the process.
P(Z>1.07)≈0.1423
Not significant
300
A poll found that 74% of the 2,027 Vampires they contacted answered yes to the
question, “All things considered, would you like to give up drinking blood, or not?”
Find the 99% large-sample confidence interval for the proportion of vampires who would
like to give up drinking blood, all things considered
Confidence Interval = 0.74 ± 2.576 * √[(0.74 * (1-0.74)) / 2027]
Confidence Interval ≈ 0.720 to 0.760
300
The average number of customers arriving at a small coffee shop is 2 customers per hour. Assuming customer arrivals follow a Poisson distribution, what is the probability that you will see at least 3 customers arrive in the next hour?
0.323323584
300
Compute the mean and standard deviation of energy_% and tempo_%
Compute the correlation between energy_% and tempo_%
Use these numbers to give the slope and intercept of the regression line
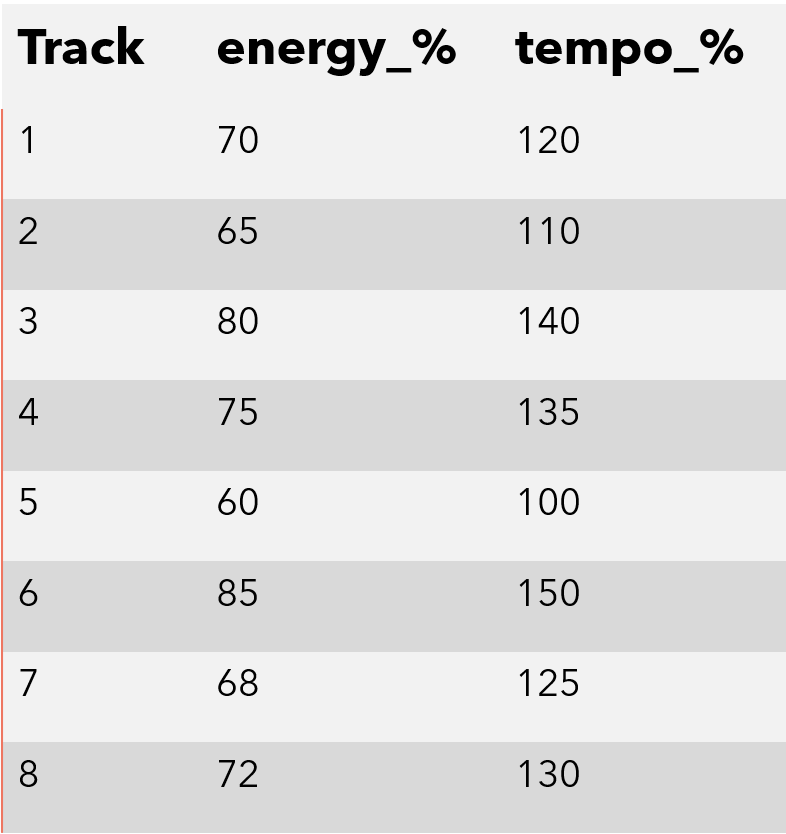
y = 1.9593x - 14.577
400
null: 𝛍1-𝛍2=-2.4, alternative: 𝛍1-𝛍2<-2.4, N1= 20, N2= 30, 𝛍_samp1=65.9, 𝛍_samp2=70.1, 𝛔_samp1=1.11, 𝛔_samp2=2.11, 𝛂=0.05. Give the p-value and whether it is significant
IF DF IS 48: p=0.00015, yes it is significant
IF DF IS 19: p=0.00045, yes it is significant
400
The distribution of blood cholesterol level in the population of young men aged 20 to 34 years is close to Normal with a mean 188 milligrams per deciliter (mg/dl) and standard deviation 41 mg/dl. You measure the blood cholesterol of 14 cross-country runners. The mean level is 172 mg/dl. Is there a statistically significant (α = 0.05) evidence that the blood cholesterol level of cross-country runners is different when compared with the population as a whole?
The hypotheses are H0 : µ = 188 HA : µ /= 188
We know σ = 41, n = 14, and ¯x = 172.
The test statistic is z = x¯ − µ0/ (σ/√ n) = 172 − 188/ (41/ √ 14) ≈ −1.46.
Norm.S.Dist(-1.46, 1) =0.072
2 x 0.072 = 0.144
400
What is the sample size that gives a margin of error of at least 1.2 for a study of the weights of narwhals that has a sample mean of x̄=1200 and a standard deviation of σ=30lbs with a confidence level of 99%
4148
400
Suppose you have two dice, a six-sided die and a twelve-sided die. You flip a fair coin, and if it comes up heads, you roll the six-sided die; if it comes up tails, you roll the twelve-sided die. Let X be the random variable giving the number you see on the die you rolled. What is P{X < 4}?
0.375
400
A teacher records the scores from a 15-question pop quiz for her class:
Quiz Scores:
3, 5, 6, 7, 7, 8, 9, 10, 10, 11, 11, 12, 14, 15, 20
She wants to determine if any of the scores are outliers using the IQR method.
[-0.5, 19.5]
Yes, 20 is an Outlier