Data
Sampling
Graphs and Charts
Other
Rules and Formulas
100
Collections of observations, such as measurements, genders, or survey responses.
data
100
A sample of n subjects is selected in such a way that every possible sample of the same size n has the same chance of being selected.
simple random sample
100
Label each category of data on the horizontal axis and the frequency or relative frequency of the category on the vertical axis. Rectangles (bars) of equal width are drawn for each category and the bars do not touch. The height of the rectangle is equal to the category’s frequency or relative frequency.
bar graph
100
Shows how data are partitioned among several categories (or classes) by listing the categories along with the number (frequency) of data in each of them.
frequency distribution (or frequency table)
100
For any two events E and F,
P(E or F) = P(E) + P(F) – P(E and F)
general addition rule
200
Data that consists of numbers representing counts or measurements.
quantitative (or numerical) data
200
Select some starting point and then select every kth (such as every 30th) element in the population.
systematic sampling
200
A bar graph whose bars are drawn in decreasing order of frequency or relative frequency.
Pareto chart
200
Displays the total number of observations less than or equal to the category.
cumulative frequency distribution
200
The probability that two events E and F both occur is
P(E and F) = P(E) ∙ P(F|E)
general multiplication rule
300
Data that consists of names or labels (not numbers that represent counts or measurements).
categorical (or qualitative) data
300
Simply use data that are very easy to get.
convenience sampling
300
Draw rectangles (bars) for each class of data. The height of each rectangle is the frequency or relative frequency of the class. The width of each rectangle is the same and the rectangles touch each other.
histogram
300
A graph that uses points, connected by line segments, to represent the frequencies for the classes.
frequency polygon
300
An ordered arrangement in which r different objects are chosen out of n different objects and repetition is not allowed.
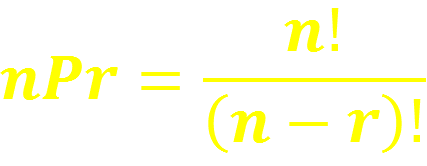
permutation
400
A type of data where the values are quantitative and the number of values is finite, or “countable”.
discrete data
400
Subdivide the population into at least two different subgroups (or strata) so that subjects within the same subgroup share the same characteristics (such as gender). Then we draw a sample from each subgroup (or stratum).
stratified sampling
400
A graph of quantitative data in which each data value is plotted as a point (or dot) above a horizontal scale of values. Dots representing equal values are stacked.
dotplot
400
A graph that represents the cumulative frequency or cumulative relative frequency for the class.
ogive (read as “oh jive”)
400
A collection, without regards to order, in which r different objects are chosen out of n different objects and repetition is not allowed.

combination
500
A type of data where infinitely many possible quantitative values exist, and where the collection of values is not countable.
continuous data
500
First divide the population area into sections (or clusters). Then we randomly select some of those clusters and choose all the members from those selected clusters.
cluster sampling
500
Presents quantitative data by separating each value into two parts: the stem and the leaf.
stemplot or stem-and-leaf plot
500
Represents the distance of a data value from the mean in terms of the number of standard deviations. That is, a measure of how many standard deviations the data value is above or below the mean.
z-score
500
If a distribution is roughly bell shaped, then
Approximately 68% of the data will lie within 1 standard deviation of the mean.
Approximately 95% of the data will lie within 2 standard deviation of the mean.
Approximately 99.7% of the data will lie within 3 standard deviation of the mean.
The Empirical Rule