Problem
Relationship Analysis
Comparative Analysis
Lucky Dip
100
What type of variables are needed for a Relationship Investigation? (Scatter graphs)
2 Numerical variables
100
What are the 2 variables and population in this graph?

Variables: Price and Weight
Population: Cars
100
What two graphs are included in a comparative investigation?
Box plot and dot plot
100
What does IQR stand for?
Interquartile Range
200
What type of variables are needed for a Comparative Investigation? (Box plots)
1 numerical and 1 categorical variable
200
What is the direction of this graph?

Positive
200
What is the centre of this graph from the summary statistics?

242.8
200
Why don't we use the mean in our investigations?
The mean is affected by outliers
300
What is a Population?
A group of things (people, animals, plants, objects, things) we are recording data from
300
What is the strength of this graph?

Strong
300
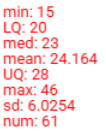
What is the IQR from these summary statistics?

1.5
300
What are two features of Normal Distribution?
1. There is only 1 peak. 2. It is the same on both sides (symmetrical) 3. It is bell shaped 4. The mean, median, and mode are very similar.
400
What is missing from this problem:
"I wonder if there is a relationship between Height (cm) and Weight (kg)"
The Population
400
What is the trend of this graph?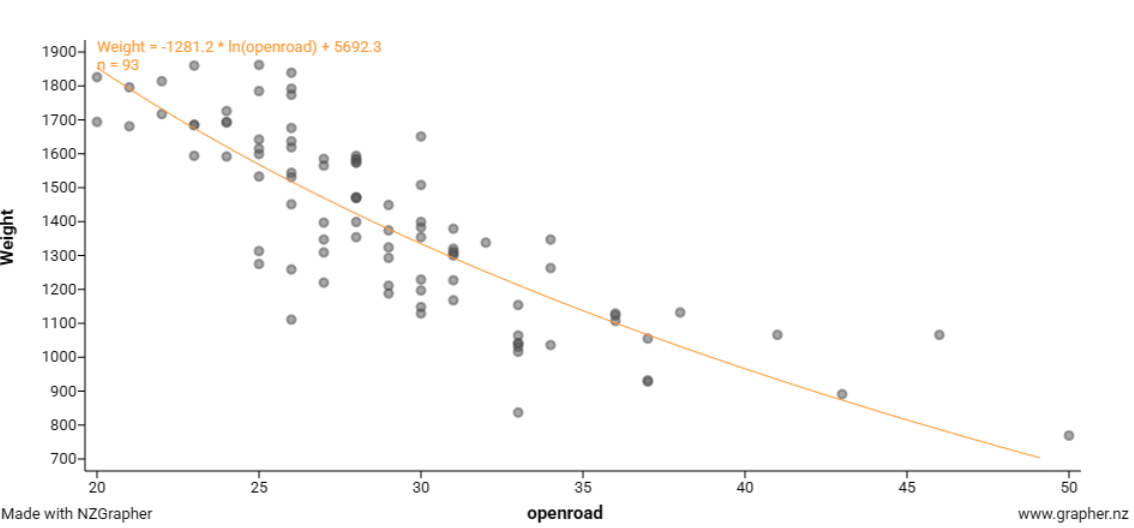
Non-Linear
400
What is the shape of this dot plot?

Right-Skewed
400
Can we make a call and why?

No, we can't make a call because both the medians overlap the opposite boxes.
500
What is missing from this problem:
"I wonder if the height of Males is more than the height of Females for all students at SCC"
The Median
500
What are the three analysis points of this graph?
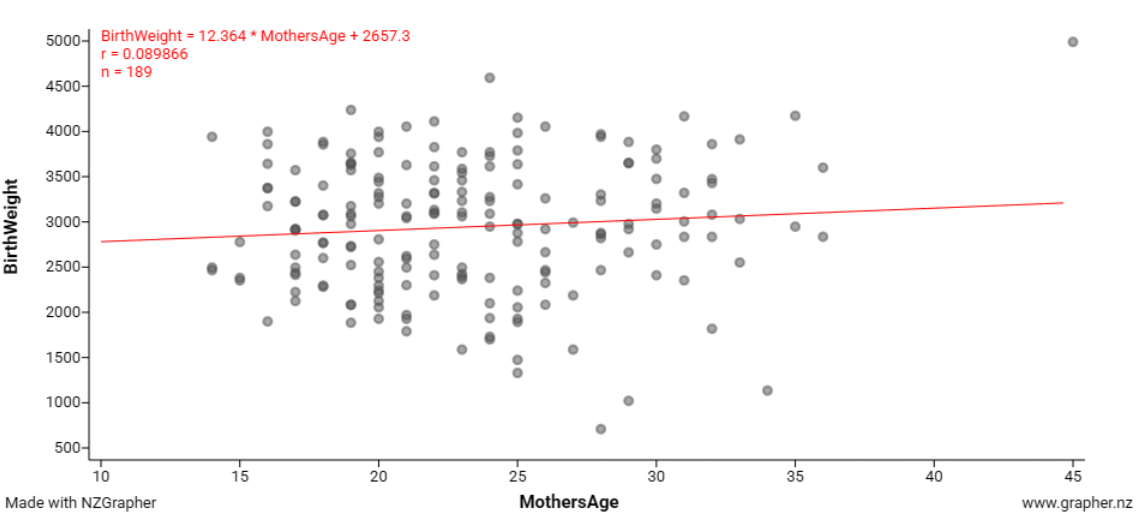
Positive, Weak, Linear
500
What is the difference in centre and spread?

Centre = 4
Spread = 4.5
500
What is the predicted height of kiwi if their weight is 4 kg?
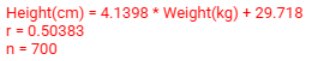
46.2772 cm