Central Tendency
Location
Spread
Coding
From graphs
100
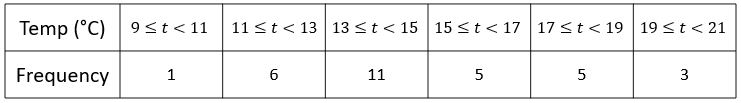
Find the median
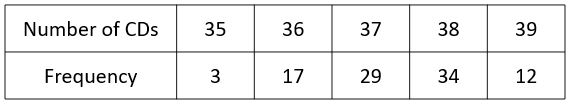
37
100
From the large data set, the daily mean pressure (hPa) during the last 16 days of July 2015 in Perth is recorded. The data is given below:
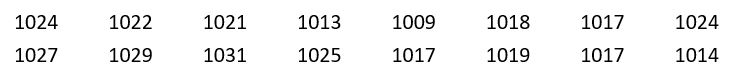
Find the lower quartile.
1017 hPa
100
Find an estimate for the IQR
5.84 - 4.87 = 0.97 tonnes
100
`A scientist measures the temperature, `x^o`C, at five different points in the nuclear reactor. Her results are: 332 355 306 317 340. The data is coded using `y=(x-300)/10.`Calculate the mean and the standard deviation of the coded data.`
bary=3, sigma_y=1.72` (3sf)
100
The masses of male and female turtles are given in grams, and summarised in the box plot. What is indicated by the x?
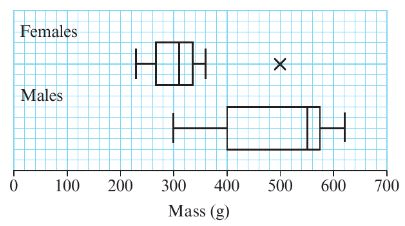
The largest female turtle weighs 500g and is an outlier in the data.
200
Find the mean
15.0 degrees Celsius
200
Find the upper quartile, Q3
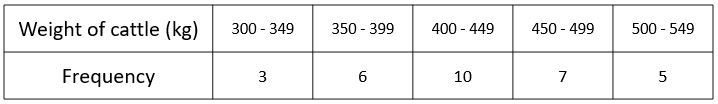
480kg
200
Calculate the 34% to 66% interpercentile range.
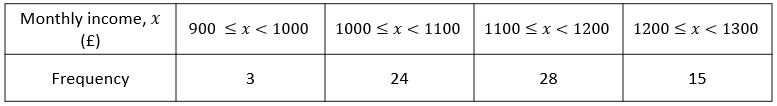
£81.87
200
`A teacher standardises the test marks of his class by adding 12 to each one and then reducing the mark by 20%. If the standardised marks are represented by `t` and the original marks by `m`, write down a formula for the coding the teacher has used.
t=0.8(m-12)
200
Work out the interquartile range
15
300
The mean of a sample of 25 observations is 6.4. The mean of a second sample of 30 observations is 7.2. Calculate the mean of all 55 observations.
6.84 (2dp)
300
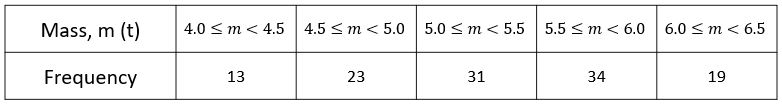
Find an estimate for the 10th percentile.
P10 = 31.9
300
The 10% to 90% interpercentile range for the daily maximum temperature for Leeming during July 1987 was 8.2oC.
Estimate the number of days in July 1987 on which the daily maximum temperature fell within this range.
24 days.
300
`The coded mean price of televisions in a shop was worked out. Using the coding `y=(x-65)/200` the mean price was 1.5. Find the true mean price of the televisions.`
365
300
Estimate how many people threw between 30 and 40 metres.
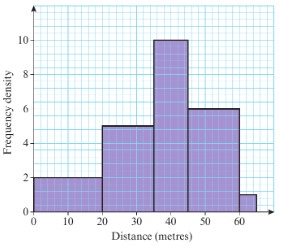
75
400
A naturalist is investigating how many eggs the endangered kakapo bird lays in each brood cycle. The results are given in this frequency table.
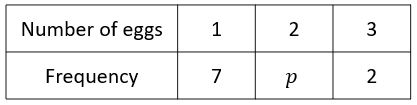
If the mean number of eggs is 1.5, find the value of p.
1
400
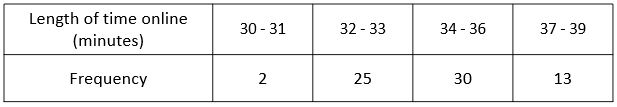
Calculate the 65th percentile.
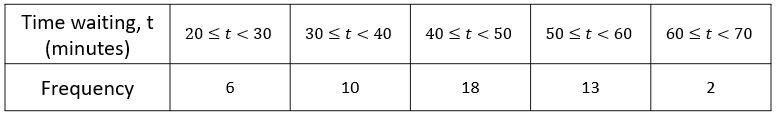
48.8 minutes
400
Calculate the standard deviation for this data.

£1.35
400
`From the large data set, data on the maximum gust, `g` knots, is recorded in Leuchars during May and June 2015. The data was coded using `h=(g-5)/10` and the following statistics found. `S_(hh)=43.58, barh=2, n=61.` Calculate the mean and standard deviation of the maximum gust in knots.`
barg=25 ` knots,` sigma_g=8.45` knots (3sf)`
400
The frequency for the class 28 to 32 was 32. What is the frequency of the 24 to 26 class?
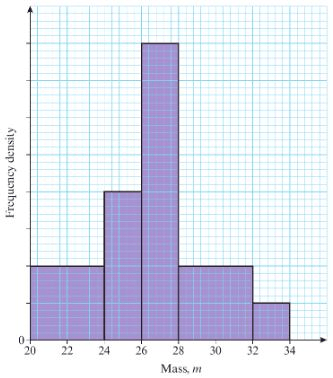
32
500
Estimate the median number of breakdowns.
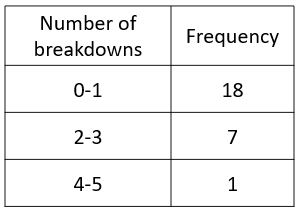
1.08
500
State why it is not possible to estimate the 90th percentile.
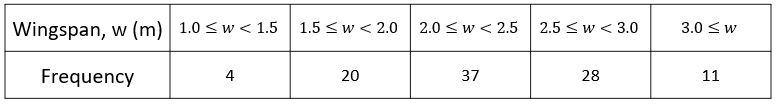
`The 90th percentile is in the `3.0<=w` class. There is no upper boundary to this class so it's not possible to estimate the 90th percentile.`
500
`For a set of 10 numbers, `sumx=50, sumx^2=310.` For a different set of 15 numbers, `sumx=86, sumx^2=568.` Find the standard deviation of the combined set of 25 numbers.`
2.35
500
`A meteorologist collected data on the annual rainfall, `x` mm, at six randomly selected places. The data was coded using `s=0.01x-10` and the following summations were obtained: `sums=16.1, sums^2=147.03.` Work out an estimate for the standard deviation of the actual annual rainfall.
416mm
500
The diagram compares the times of runners from two running clubs. Compare and contrast these two box plots.
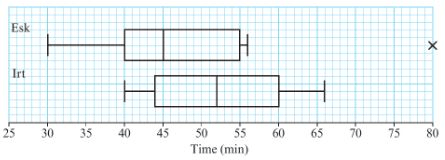
Comparing the medians shows that the runners from Esk club were the fastest on average. The interquartile ranges are similar which shows that the middle 50% of runners from each club are similarly spread in their times.