Mean Median Mode
Scatterplots
Histograms and Frequency Tables
Box and Whiskers
Normal Distribution
100
The _______ is calculated by adding all the numbers in the data set and then dividing your sum by how many numbers you added.
What is Mean?
100
A data point that is very different from the rest of the data
What is an outlier?
100
For a histogram, the frequency is always on which axis?
What is the y axis?
100
The 5 values that are graphed on a box and whisker plot
What is Minimum, 1st Quartile, Median, 3rd Quartile, Maximum?
100
The shape of the graph of a normal distribution
What is bell shaped?
200
The _______ is the value that appears most frequently in a data set.
What is Mode?
200
A line on a scatterplot that helps show the correlation between data sets more clearly
Normally goes through at least 2 points
What is line of best fit?
200
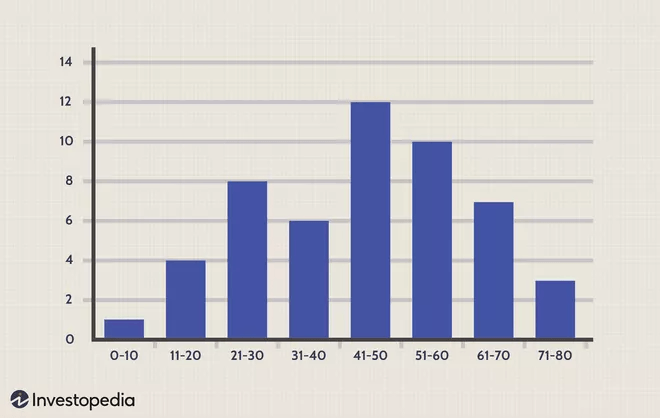
This histogram is labeled correctly
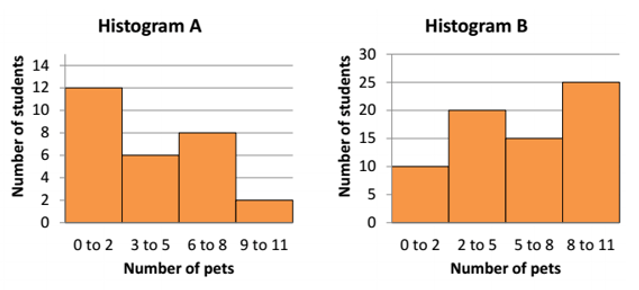
What is Histogram A?
200
Find the 5 values you would use to construct a box-and-whisker plot for the data set: 4, 7, 5, 3, 9, 6, 4
Minimum = 3
1st Q = 4
Median = 5
3rd Q = 7
Maximum = 9
200
A normal distribution has a mean of 15 and a standard deviation of 3. The value that is 3 negative standard deviations away from the mean is this.
What is 6?
300
The ________ is the number in the middle of the data set after the numbers have been written in order from least to greatest.
What is Median?
300
Describe the relationship between age and
accidents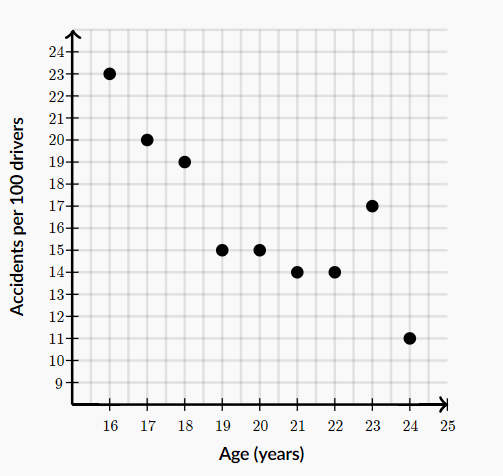
What is a negative linear correlation?
300
The number of students represented in the histogram
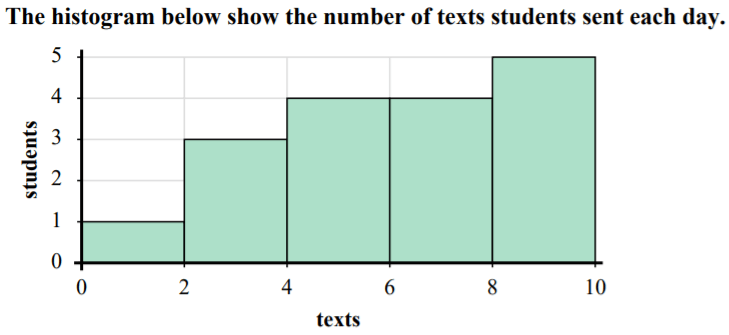
What is 17 students?
300
Can you determine the mean from a box-and-whisker plot?
What is No?
300
A normal distribution has a mean of 24 and a standard deviation of 6. 68% of the values of this distribution fall between these values
What is 18 and 30?
400
The most common measures of central tendency
What is Mean, Median and Mode?
400
Using the scatterplot below, come up with a reasonable estimate for y when x =10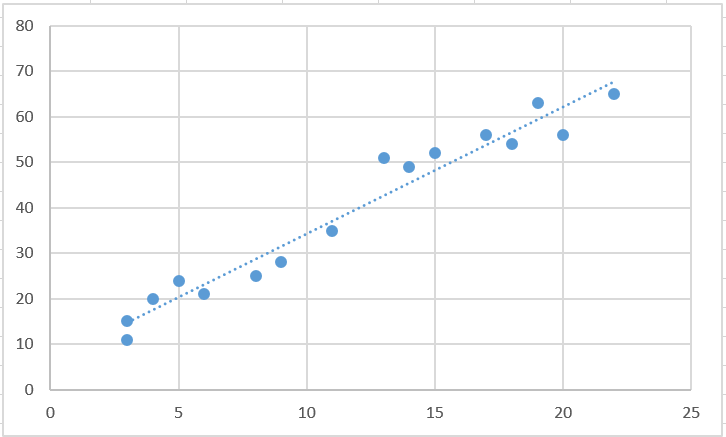
What is 35?
400
Describe the distribution
What is normal or bell shaped?
400
Find the percent of the class that scored above 72
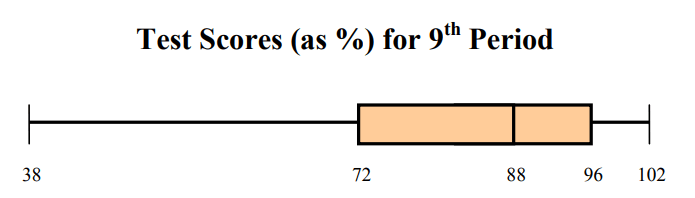
What is 75%
400
A normal distribution has a mean of 100 and a standard deviation of 10. The percentage of data values that fall between the values of 80 and 120 is this.
What is 95%?
500
The mean of this set: 10, 10, 20, 40, 70
What is 30?
500
If the line of best for a scatterplot is y=-4x+59, find x when y=-13
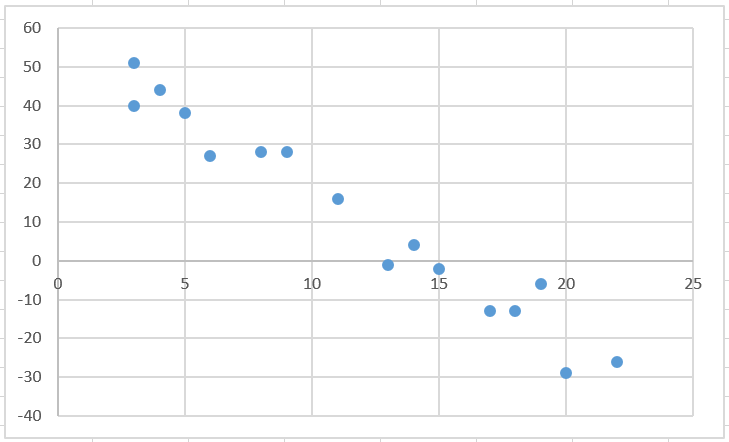
What is x=18?
500
The percent of cars that get 25-45 miles per gallon
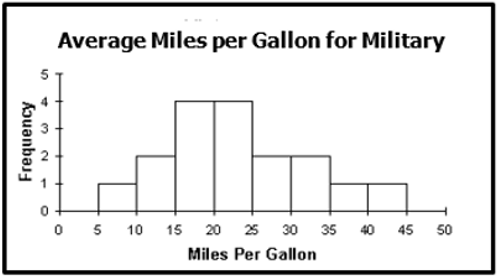
What is 35%?
500
Describe the distribution of the two states
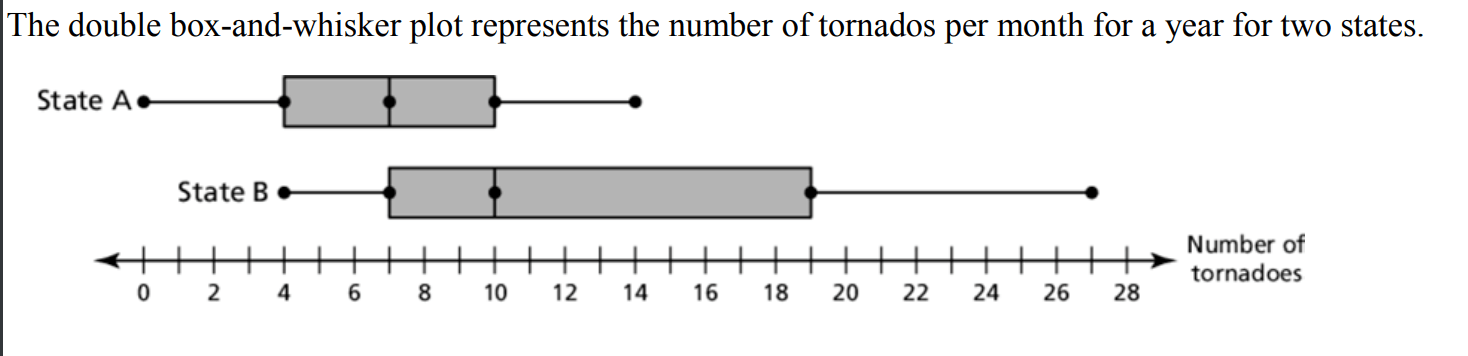
State A=Normal
State B=Right Skewed
500
The heights of a group of seven-year-old children are normally distributed with mean 117 cm and standard deviation 5 cm. If 500 children are measured, estimate the number of children between 112 and 122 cm
What is 340 children?