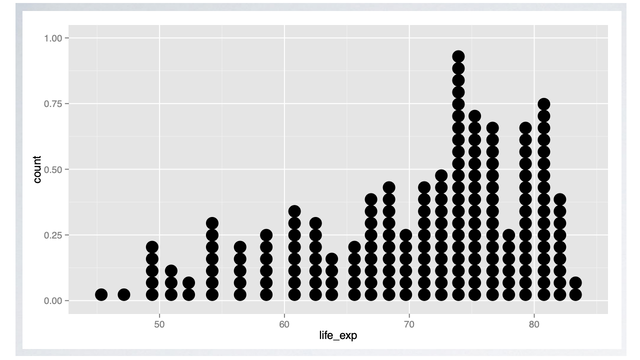
The direction this graph is skewed.
What is skewed right?

Graph the shows change over time.
What is a time series graph?

If I want a histogram with 4 classes, the class width will be this.
60 32 43 49 49 39 71 74 43 38
60 52 34 35 62 50 57 40 31 58
What is 11?

The stems on the left side of a stem and leaf must go in order from least to greatest and must not skip any numbers. True or false?
What is true?

This is data that must come in specific increments-usually only whole numbers.
What is discrete data?

The direction that this graph is skewed.

What is skewed left?

The range of this data is

What is 45?

This is the frequency of the first class.
60 32 43 49 49 39 71 74 43 38
60 52 34 35 62 50 57 40 31 58
What is 7?
They are the only types of graphs we studied to represent categorical data
What are bar graph and pie chart or circle graph?

This is the statistic we get from the sample.
What is a descriptive statistic?

How this graph is best described.

What is symmetric unimodal?

The percent of scores 80 or above. (round to the nearest whole number)

What is 47%?

This is the frequency of the final class.
60 32 43 49 49 39 71 74 43 38
60 52 34 35 62 50 57 40 31 58
What is 2?

200 students were asked their favorite type of fruit. This many students preferred apples.
What is 30?

The name of the specialized or technical terms that may bias a survey.
What is jargon?

Shape when all of the bars of the histogram are approximately the same height.
What is uniform?

Only the stem and leaf needs this.
What is a key?

What is the total frequency of all classes?
:max_bytes(150000):strip_icc()/Histogram1-92513160f945482e95c1afc81cb5901e.png)
What is 51?

This is a bar graph that goes from most to least.
What is a pareto graph?

The phenomenon where people respond either positively or negatively to fake medicine, surgery, or other procedures.
What is the placebo effect?

The type of distribution where the mean, median, and the mode are all in the center.
What is symmetric unimodal?
The only graph we studied that shows both quantitative data and percentages.
What is an ogive?

If I create an ogive, this will be the percentage for the third class. (round to the nearest whole number)
:max_bytes(150000):strip_icc()/Histogram1-92513160f945482e95c1afc81cb5901e.png)
What is 25%?

There are 41 people who prefer McDonalds, 21 Subway, 55 Zaxby's, and 13 others. This is the relative frequency for Subway.
What is a 0.16? (not 16%)

The generalized statements we make about the whole population based on the specific percentages we get from the sample.
What is inferential statistics or inferences?

