Frequency Tables
Surveying and Sampling
Describing Measures of Centre
Calculating Measures of Centre
Measures of Spread
100
The total number of people surveyed.

100
100
This is a survey conducted on an entire population.
Census
100
The statistical term used to describe the average.
Mean
100
What is the mode of the numbers below?
63, 94, 27, 25, 63
63
100
The area of variation between upper and lower limits on a particular scale is called the:
Range
200
How many more males said that they prefer winter to summer?

What is 4?
200
When you survey a part of a population, you have collected a:
Sample
200
Describe how you calculate an average.
Add all the values together and divide by the total number of values.
200
What is the mean of the numbers below?
1, 4, 5, 11, 4
5
200
How do you calculate the range?
Range = the highest number - the lowest number
300
Of the left-handed people, how many more prefer pancakes over waffles?
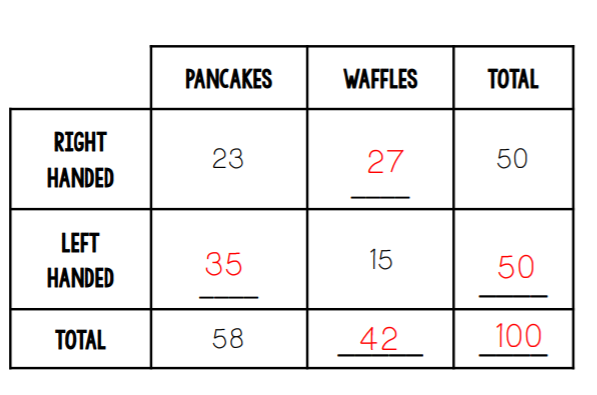
What is 20?
300
How many ways can data be represented in a histogram and name them?
There are three ways data can be represented in a histogram.
1. Symmetric
2. Skewed
3. Bi modal
300
What are the steps for working out the median?
1. Put the numbers in ascending order
2. Select the middle number.
3. If there are two middle numbers you will need to find the mean of the two numbers.
300
What is the median of the numbers below?
54, 62, 72, 25, 17
54
300
Does an outlier affect the range?
Yes, an outlier will affect the range of a dataset.
400
Of the people surveyed, the relative frequency of those who have gotten a speeding ticket.
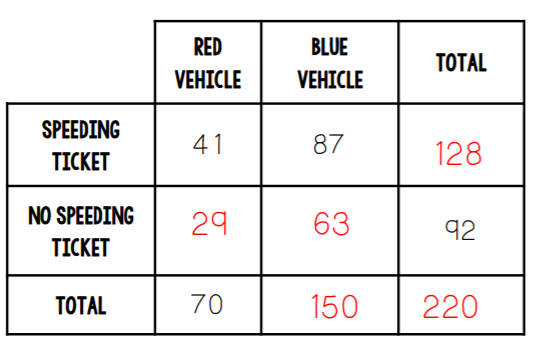
What is 58%?
400
Name two factors that affect the accuracy of a survey's findings.
Sample size; Not a representative sample of population; Bias; Measurement errors; Outliers
400
Describe the mode. Can there be more than one?
The mode is the most common value, i.e. the one with the highest frequency. There can be more than one mode.
400
What are the mean, mode and median of the numbers below?
5, 12, 4, 7, 7
Mean=7 Median=7 Mode=7
400
What is the range of the set of scores below? Show full working on the board.
7 5 1 6 7 5 7 10 7 6
Range = highest number - lowest number
Highest number = 10
Lowest number = 1
10 - 1 = 9
Range = 9
500
Of the people who have kids, the relative frequency of those who do not have pets.

What is 35%?
500
If a data distribution is symmetric what two measures of centre will be approximately equal?
The mean and median will be approximately equal if the data is symmetric.
500
Define an outlier and explain which measures of centre are affected by an outlier.
An outlier is a data point that is significantly smaller or larger than the rest of the data. The mean can be significantly affected by an outlier.
500
What are the mean, median, and mode of the numbers below?
121, 323, 454, 676, 919, 323
Mean=469.3 Median=565 Mode=323
500
Which dataset has a greater range?
Dataset A: 2, 14, 5, 9, 11, 7
Dataset B: 14, 10, 1, 6, 12, 3
Dataset B