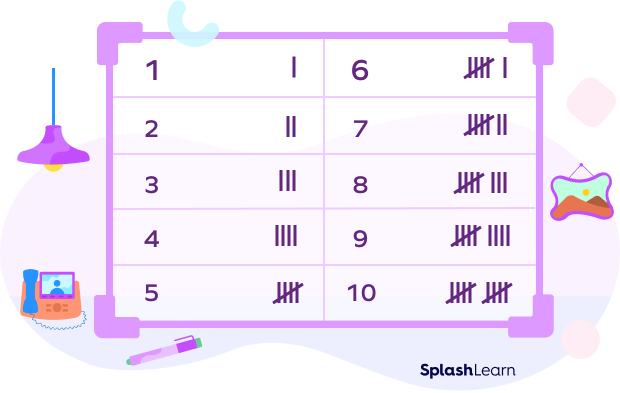
What is the mode:
1,2,2,3,3,4,4,5,5,
2,3,4,5
What is the median?
1,2,3,4,5
3
What type of graph is this?
Line Graph
What is the mean?
10, 10
10
The dog had six toys. Three tennis balls, one chew toy and two plush toys. Which toy is the mode?
Tennis balls
A teacher tracks how many books each student reads over a month. The numbers of books read by each student are as follows:
2, 5, 3, 5, 4, 2, 5, 1, 2, 5
What is the mode of the number of books read by the students?
5
A teacher records the scores of a group of students on a quiz. The scores are:
4, 6, 8, 7, 5
What is the median score?
6
A survey was conducted to find out students' favorite types of sports. The results showed that 40 students like soccer, 25 like basketball, 20 like tennis, and 15 like swimming.
If this data were displayed in a bar graph, which sport would have the tallest bar? Which sport would have the shortest?
Soccer 40
Swimming 15
A student scores the following marks in five quizzes: 6, 8, 7, 9, and 10.
What is the mean score?
8
The average score of 5 students on a test is 72. Four of the scores are 70, 75, 68, and 74. What is the missing score?
73
A school cafeteria tracks the type of fruit students choose over one week. The options are Apples, Bananas, Oranges, and Grapes. The results are recorded in the frequency table below:
FruitFrequency: Apples 7, Bananas 4, Oranges 9, Grapes 3
What is the mode of the fruit choices made by students?
Oranges with 9
A teacher records the number of minutes 10 students spent on their homework each day for a week. The times (in minutes) are:
12, 15, 18, 20, 22, 24, 25, 28, 30, 35
What is the median time spent on homework?
23 minutes
A school records the number of books read by students in different grades over a month:
- Grade 1: 15 books
- Grade 2: 25 books
- Grade 3: 40 books
- Grade 4: 30 books
- Grade 5: 20 books
Question:
What type of graph would best represent this data to show the comparison of books read across different grades, and why?
A bar graph would be best because it allows easy comparison between categories (the different grades) and clearly shows the number of books read by each grade.
A dot plot shows the number of pets owned by different families in a neighbourhood:
- 1 pet: ● ● ● ●
- 2 pets: ● ● ● ● ●
- 3 pets: ● ● ●
- 4 pets: ● ●
2.21
The mean weight of 6 packages is 4.5 kg.
Five packages weigh 3.8 kg, 4.2 kg, 5.0 kg, 4.7 kg, and 4.9 kg. What is the weight of the missing package?
4.4kg
A researcher records the number of hours different animals sleep in a day. The recorded values, in hours, are as follows:
8, 7, 8, 6, 5, 6, 7, 6, 8, 5, 6, 7, 8
What is the mode of the sleep hours for these animals?
6 an 8
A wildlife researcher records the weights (in kilograms) of 11 different animals in a sanctuary. The weights are as follows:
4.2, 5.1, 6.5, 7.3, 5.5, 8.6, 5.9, 4.8, 6.1, 7.8, 5.7
What is the median weight of these animals?
5.9
A fitness coach records the number of hours a group of athletes trains each week. The data is grouped into ranges:
- 0-2 hours: 3 athletes
- 3-5 hours: 7 athletes
- 6-8 hours: 10 athletes
- 9-11 hours: 5 athletes
- 12-14 hours: 2 athletes
What type of graph would best represent this data to show the distribution of training hours among the athletes, and why?
A histogram is the best choice because it displays the frequency of data within specified ranges (intervals), making it easier to see how many athletes fall into each range of training hours.
What is the mean number of homework hours per week BY GRADE not students? 
20 hours
A dataset has 8 values: 12, 14, 15, _, 18, 20, 22, and 24. The mean of all values is 18, and the median is 17. What is the missing value?
19
A group of scientists observe how many flowers bloom on certain plants over several weeks. The number of flowers per plant, recorded each week, are:
3, 7, 5, 6, 7, 3, 4, 7, 5, 6, 3, 4, 7, 5, 6, 4, 3, 5, 6, 4
Determine the mode of the number of flowers blooming per plant, if any.
7
What is the median?

8
- What type of graph would best represent the changes in each species’ population over time, and why?
- Which species shows the most consistent growth over the years? Explain your reasoning.

Hawks show the most consistent growth, increasing steadily each year without any decrease or fluctuation.
A researcher studies the daily rainfall (in millimetres) across five cities over a week. The data collected for each city is as follows:
- City A: 12, 15, 20, 18, 25, 30, 10
- City B: 8, 12, 15, 10, 20, 18, 14
- City C: 5, 7, 8, 10, 15, 12, 9
- City D: 20, 25, 30, 22, 15, 28, 24
- City E: 10, 8, 12, 10, 15, 20, 11
Calculate the mean daily rainfall for each city over the week.
The mean daily rainfall for each city over the week is as follows:
- City A: 18.57 mm
- City B: 13.86 mm
- City C: 9.43 mm
- City D: 23.43 mm
- City E: 12.29 mm
A teacher records the test scores of 9 students in ascending order as follows:
50, 55, 60, 65, _, 75, 80, 85, 90
The median score is 70, and the mean score is 70 as well. What is the missing score?
70