Mean, Median & Mode
5 Number Summary & IQR
Graphs
100
Find the mode of the data set.
14, 14, 17, 9, 11, 17, 24, 22, 17, 12
17
100
Find the IQR of the data set.
15, 27, 16, 18, 20, 25, 13
10
100
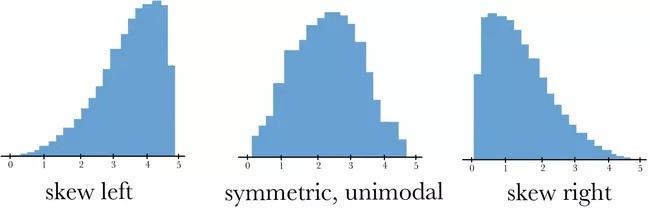
Draw and label the 3 shapes of histograms.
200
Find the median of the data set.
9, 10, 3, 5, 9, 7, 10, 3
8
200
Find the 5 number summary of the data set.
7, 5, 3, 1, 9, 6, 6
Min: 1
Q1: 3
Median: 6
Q3: 7
Max: 9
200
Would it be more accurate to use mean or median as a measure of center for the data in this dot plot?
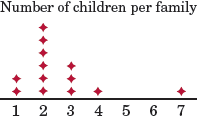
Median
300
Find the mode of the data set.
24, 33, 7, 36, 18, 14, 45, 30, 0, 3
No mode
300
Find the 5 number summary of the data set.
82, 87, 91, 61, 61, 67, 84, 91
Min: 61
Q1: 64
Median: 83
Q3: 89
Max: 91
300
What fraction of the people read 5 or more books?
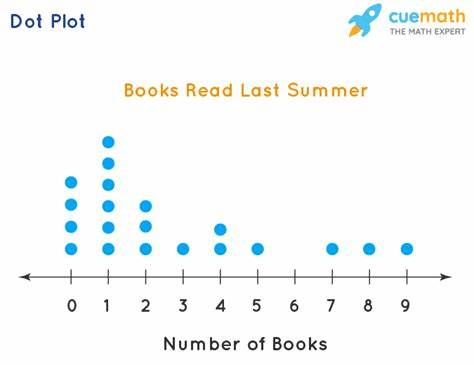
1/5
400
Find the mean of the data set.
3, 5, 10, 1, 1
4
400
Find the IQR of the data set.
27, 19, 38, 11, 8, 41, 30, 33
20.5
400
What percent of students had 0 or 1 incorrect?
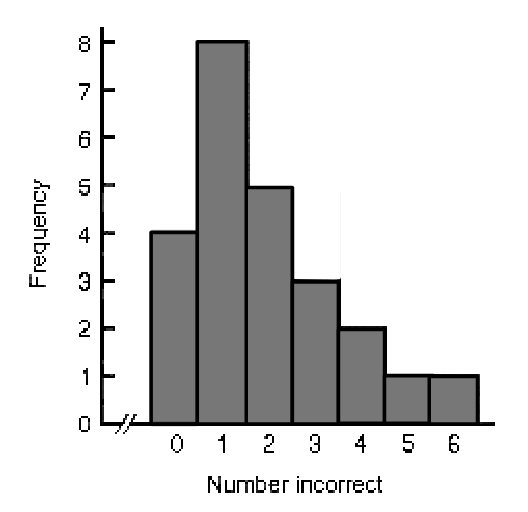
50%
500
Find the mean of the data set.
3, 4, 5, 6, 7, 8
5.5
500
What is the IQR and 5 number summary of the data set based on the box plot?
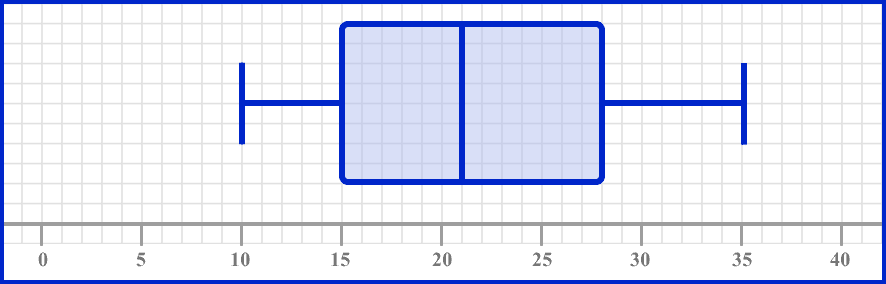
IQR: 13
Min: 10
Q1: 15
Median: 21
Q3: 28
Max: 35
500
What is the average length of the paper clips based on this dot plot.
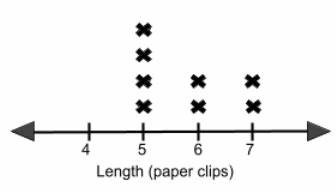
5.75 units