Vocabulary
Mean, Median, Mode, Range, and IQR
Data Distributions and Outliers
Frequency Tables, Histograms, and Box and Whisker Plots
Normal Distributions
100
the average of all numbers in the data set
What is mean?
100
Find the mode: 10, 9, 4, 4, 8, 8, 8, 4, 7, 6, 11, 14, 27
What is 4 and 8?
100
State the type of data distribution:
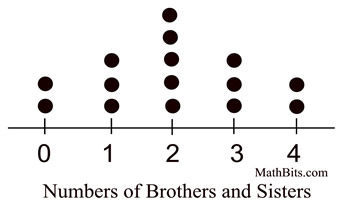
What is symmetric?
100
A summary of data that lists each value or category and shows how often it appears (its frequency) in a dataset
What is a frequency table?
100
For a normal distribution, what percent of data falls within one standard deviation of the mean?
What is 68%?
200
the median of the lower half of a data set
What is first quartile (Q1) ?
200
Find the median of the data set: {3, 7, 12, 18, 25, 33, 42, 52, 63, 75, 88}
What is 33?
200
State the type of data distribution:
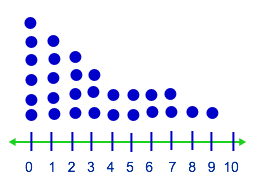
What is right-skewed?
200
A visual representation of the distribution of numerical data, grouping values into continuous, adjacent "bins" or intervals, and showing the frequency (count) of data points in each bin
What is a histogram?
200
For a normal distribution, what percent of data falls within 2 standard deviations of the mean?
What is 95%?
300
the difference between the third and first quartiles; represents the range of the middle half of the data
What is interquartile range (IQR) ?
300
Find the mean of the following set of data: 13, 23, 21, 20, 21, 24, 18
What is 20?
300
How do you find the LOWER boundary for outliers?
What is Q1 - 1.5(IQR)?
300
Find the median of the box plot below:

What is 85?
300
For a normal distribution, what percent of data falls within 3 standard deviations of the mean?
What is 99.7%?
400
a bell shaped, symmetric distribution with a tail on each end
What is normal distribution?
400
Find the IQR: {4, 8, 12, 16, 20, 24, 28}
What is 16?
400
Find the upper outlier boundary for the data set : {2, 5, 8, 12, 15, 19, 25, 30, 37}
What is 72.5?
400
Find the IQR of the box-plot below:
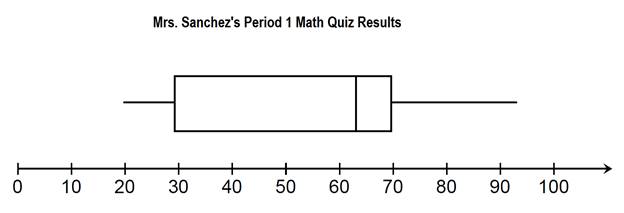
What is 40?
400
For this normal distribution, what percent of values will fall between 1000 and 1300?

What is 68%?
500
the square root of the average of the squared differences between individual data values and the mean
What is standard deviation?
500
Find a possible missing value in the set of data if the range is 20. 14, 8, 17, 21, ____, 11, 3, 13
What is 1 or 23?
500
Is there an outlier in the data set below?
{3, 4, 5, 6, 7, 8, 9, 10, 16}
Yes, Q3+1.5(IQR) is 9+1.5(4) =15, and since 16>15, 16 is an outlier.
500
Estimate the mean for the histogram below:

What is 66.3?
500
If a random data value was pulled from this data distribution, what is the probability it will be between 700 and 1300?
What is 83.855?