Standard Deviation
Mean, Median, Mode
Range
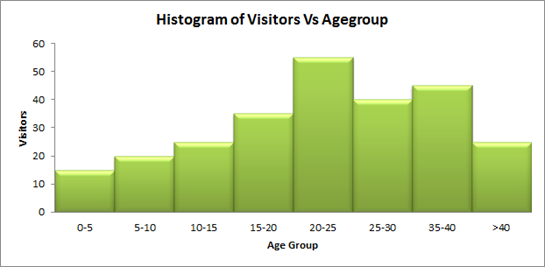
Dot Plots and Histograms
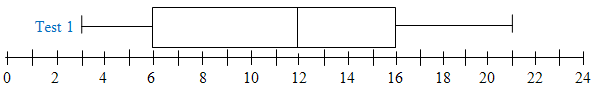
Box Plots
100
3, 6, 6, 7, 8, 11, 15, 16
What is 3.75?
100
The mode of
1.06; 9.3; 59.59; 6.01; 25.17; 1.06; 6; 1.06; 0.7
What is 1.06?
100
The range of
12; 12; 14; 15; 12; 16; 12; 18
What is 12 - 18?
6?
100
The mode of the following data.
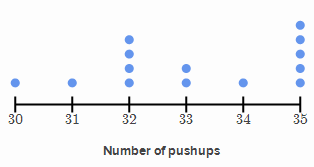
What is 35?
100
 The range of the data
What is 3 - 21?
18?
200
10, 7, 13, 10, 8
What is 1.68
200
The median of
7; 8; 16; 11; 9; 13
What is 10?
200
The range of
33; 4; 5; 6; 10; 15; 17; 18; 19; 21; 29
What is 4 - 33?
29?
200
The median of the following data.
What is 5?
200
The median of the data
What is 12?
300
110, 114, 104, 108, 106
What is 2.88
300
The median of
7; 12; 10; 12; 16; 10; 14; 1
What is 11?
300
The range of
39; 91; 43; 73; 198; 34; 29;
What is 29 - 198?
169?
300
The interval that is the mode
What is 16-20?
300
***DAILY DOUBLE***
The first quartile of the following data
120; 125; 130; 134; 136; 140; 145; 145; 150; 170; 190;
What is 130?
400
85, 90, 68, 75, 79
What is 6.48
400
The mean of
13; 9; 4; 19; 7; 8; 17
What is 11?
400
***DAILY DOUBLE***
The range of
49; 53; 35; 69; 69; 35; 84; 77
What is 35 - 84?
49?
400

Which interval has 300 employees?
What is 11-21?
400
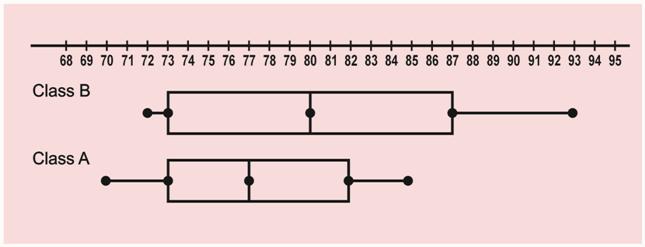
True, False, or Cannot Be Determined.
The median of class B scored higher than over half of class A.
What is True?
500
29, 58, 15, 129, 75, 22
What is 32.67
500
***DAILY DOUBLE***
The mean of
16; 18; 12; 9; 7; 1; 16; 16
ROUND TO THE TENTHS PLACE
What is 11.9?
500
The Range of
30.3; 45; 65; 72; 78; 89; 97; 100; 100.2
What is 30.3 - 100.2?
69.9?
500
A conclusion that you can draw from this data.
Correct answers at the teacher's discretion
500
True, false, or Cannot be Determined.
Some students failed the class.
What is false?
Lowest score was a 70.