Definitions/How to...
Look, Organize, Find
Graphs
Calculations
Data and Statistics
100
What is the number that appears the most in the data set.
Mode
100
Find the range of the data set:
12, 11, 13, 11, 12, 22, 18, 16, 19, 21, 15
Range: 22-11 = 11
100
TWO of these are NOT shown in a box plot:
maximum, mean, median, minimum, mode, quartile 1, quartile 3
What are Mean and Mode?
100
What is Mode?
The number that occurs most often in a set of data
100
Name ONE measure of center (describes the middle of the data set)
Mean, Median or Mode
200
The range helps measure....
the spread of the data.
200
Which of the 3 measures of center is MOST affected by an outlier?
Mean gives more weight to outliers than median or mode does.
200
Name the shape of the graph.
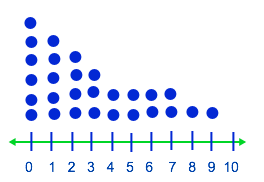
Skewed Right
200
Find the Mean of the set:
2, 5, 5
4
200
Scores on a recent 6th grade math test.
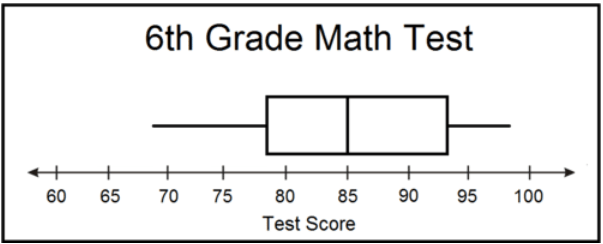
50% of the data values are less than this number.
85
300
Explain the steps to find the mean.
1. Add all the data
2. Divide the total by the number of data
300
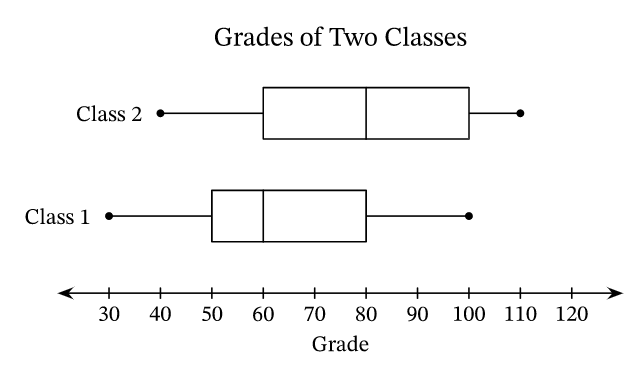 Which class has a higher center?
Class 2. Their center is 80 and class 1 is at 60.
300
What are the three shapes of dot plot?
Symmetric
Skewed Left
Skewed Right
300
Find the Mode of the following set of data
11, 11, 12, 12, 12, 13, 15, 18, 16, 19, 21, 22
12
300
Find the Median of the set
11, 11, 12, 13, 15, 16, 19
13
400
You find the median by doing...
What is ordering them from least to greatest, crossing them out till you find the middle number. (If there are two numbers find the mean)
400
Who was the 1st president of the US?
Is this a statistical or non-statistical question?
Non - Statistical
400
The distribution with the largest percentage of students 66 inches or shorter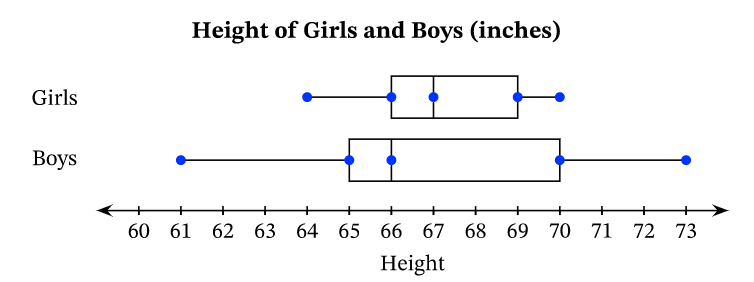
What is the IQR for Boys and Girls?
Boys = 5
Girls = 3
400
What is the peak of this data set?
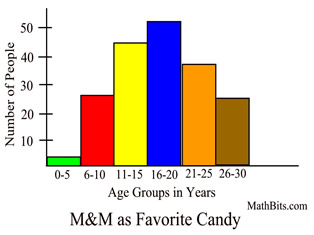
16-20 years old
400
Explain how do you find the range of the given set of data
Range is the difference between the greatest and the least data.
500
TRUE or FALSE: "How many siblings do kids in this class have?" is a statistical question
What is TRUE?
500
Find the mean absolute deviation of this data set.
24, 5 , 7, 4, 10
Mean = 10.
Diff: 14,5,3,6,0
Mean Absolute Deviation = 28/5 = 5.6
500
Which data most likely have variability for one school during a single school year?
A. The number of students absent each day
B. The amount of time for lunch period each day
C. The cost of slice of cheese pizza each day
A
500
Explain how to find the mean of a set of data.
All up all the numbers and divide by the amount of numbers given.
500
Name TWO measures of variation (describing the spread of the data)
Range
Interquartile Range
Mean Absolute Deviation