Shape
Statistical Measures
5 Number Summary
Random
All Things Meyer
100
What is the shape of this histogram?

Symmetric
100
What is used to measure the variability of the data set?
IQR and standard deviation.
100
What is the Minimum of the data set: 6, 9, 10, 12, 1, 3, 5, 7, 2, 3, 4
1
100
What was the score of the football game on Friday?
8-6
100
What high school did Meyer's son graduate from?
TJ
200
What is the shape of this histogram?
This distribution is bimodal.
200
What is the appropriate measure of the center of the following data?
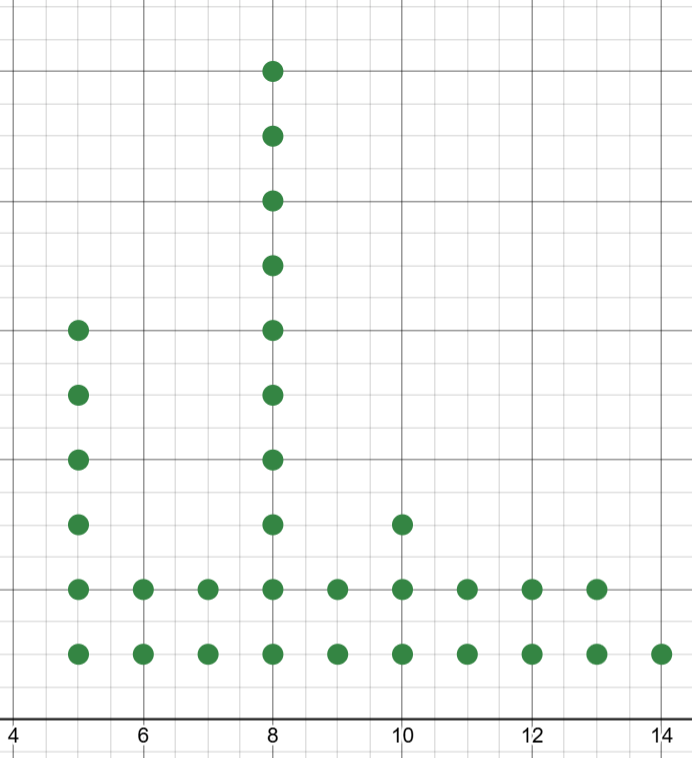
Median, because the distribution is skewed right.
200
What is the Median of the following data set:
2, 4, 6, 8, 10, 12, 14, 16, 18, 20, 22
12
200
What is the principals name?
Christoff
200
What sports does Meyer coach during the school year?
Flag Football and Swimming
300
What is the shape of this distribution?
This distribution is uniform.
300
What is appropriate measure of the center of the data?
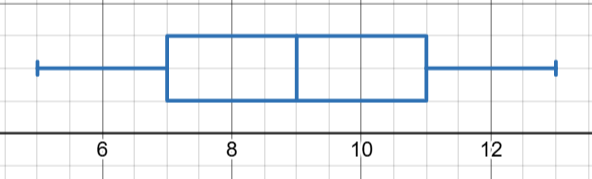
Mean, because the distribution is symmetrical.
300
What is Q3 of the following box plot?
10
300
Name two math teachers at TJ (not Meyer)
Hadera, Strickland, Parra, Fitz, Griffin, Crouse, Dunn, Prat, Logan, Ms. Kate, Tarullo. Franco
300
How many years has Meyer been teaching?
22
400
What is the shape of the distribution?

The distribution is skewed right.
400
What is the appropriate measure of variability of the data set?
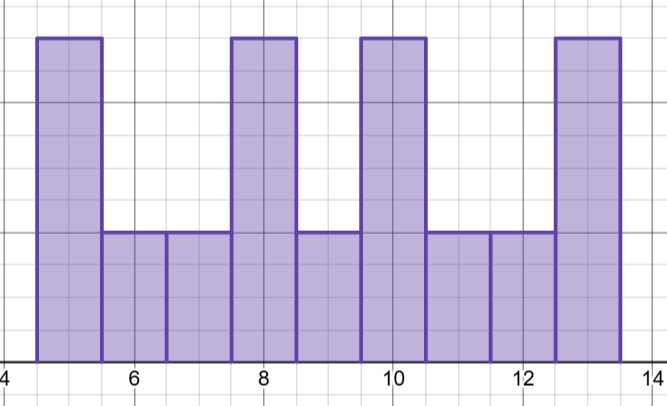
Standard deviation, because the distribution is symmetrical.
400
What is the IQR of the following box plot?
5
400
If the max of a data set is 76 and the range is 34, what is the min of the data set?
42
400
What is one of Meyer's hobbies?
Getting tattoos, hiking, kayaking, reading, fishing, camping.
500
What is the shape of the distribution?
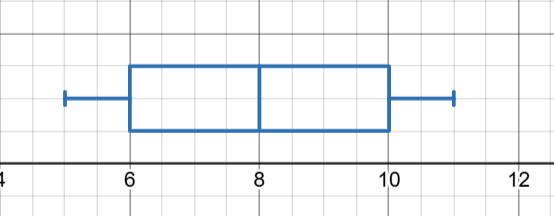
Symmetrical, or bimodal, or uniform
500
If the outlier is removed, what is the most appropriate measure of variability of the data set?
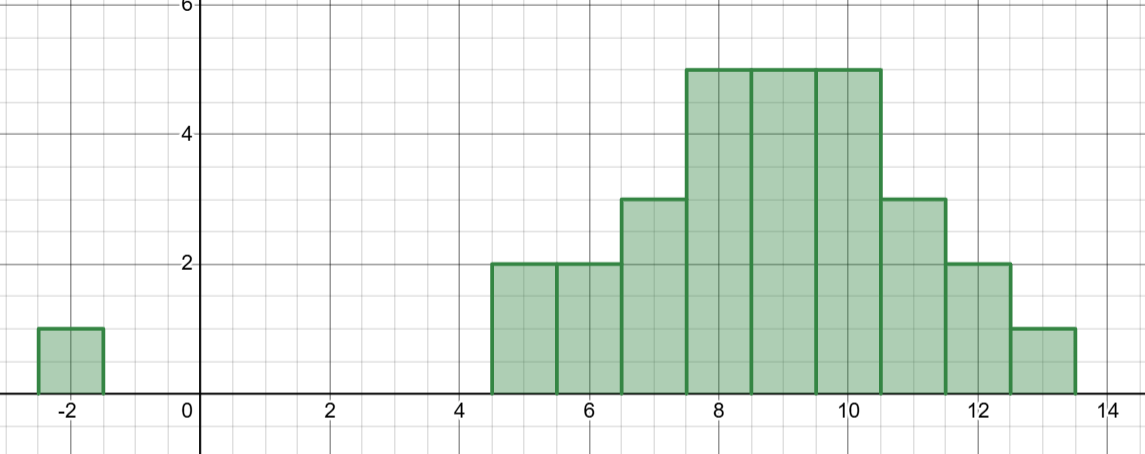
Standard deviation.
500
What is the range of the box plot?
13
500
If the IQR of a data set is 60 and Q1 is 20, what is Q3?
80
500
How many years did Meyer win Coach of the Year and which sport?
2 years (back to back) for boys swimming