Definitions/How to...
Look, Organize, Find
6th Grade- Data and Statistics Part 1
6th Grade- Data and Statistics Part 2
Data and Statistics
100
Mode is defined as..
What is the number that appears the most in the data set.
100
The minimum and maximum of the data set
12, 11, 13, 11, 12, 22, 18, 16, 19, 21, 15
Minimum- 11
Maximum- 22
100
TWO of these are NOT shown in a box plot:
maximum, mean, median, minimum, mode, quartile 1, quartile 3
What are Mean and Mode?
100
The weight of seven football players is listed in pounds. 210, 275, 125, 400, 340
Find the MEAN of the football players?
270
100
What is the median?
The median describes the middle of the data set.
200
The range is defined as..
What is the difference between the maximum and minimum?
200
The dot plot shows the number of runs scored by a baseball team for each game they played in the month of April.
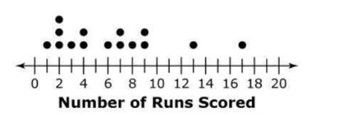
How many games did the team play during April?
15
200
Scores on a recent 6th grade math test.
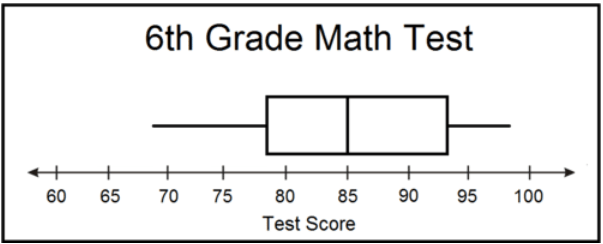
What is the median?
The median is 85
300
Explain the steps to find the mean.
1. Add all the data
2. Divide the total by the number of data
300
Who was the 1st president of the US?
Is this a statistical or non-statistical question?
Non - Statistical
300
Fill in the blanks:
1) If you add in a number that is greater than the mean, the mean goes__________.
2) If you add in a number that is less than the mean, the mean goes _________.
1) If you add in a number that is greater than the mean, the mean goes up.
2) If you add in a number that is less than the mean, the mean goes down.
300
Find the Median of the set
11, 11, 12, 13, 15, 16, 19
13
400
You find the median by doing...
What is ordering them from least to greatest, crossing them out till you find the middle number. (If there are two numbers find the mean)
400
If you remove a large outlier, the mean would decrease: true or false
true, the mean would decrease if you remove a large outlier
the mean would increase if you remove a small outlier
400
Which interval is the peak of the graph? Think about the hill of a roller coaster.
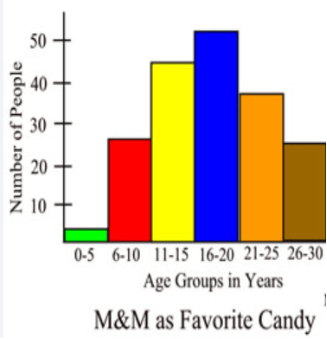
The peak is at 16-20 because it is the tallest.
400
What are two characteristics of a histogram?
1. The bars are connected
2. Each bar shows a range of numbers
500
TRUE or FALSE: "How many siblings do kids in this class have?" is a statistical question
What is TRUE?
500
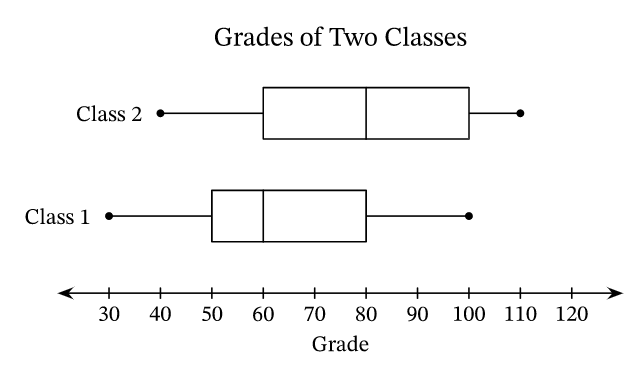 What is the range for class 1 and class 2?
class 1 = 70
class 2 = 70
500
How is the mean effected by an outlier? (talk about both ways)
Including a high outlier will increase the mean.
Including a low outlier will decrease the mean.