Picturing Distributions with Graphs
Describing Distributions with Numbers
Variable Statistics
Scatterplots
Regression
100
A table that shows data divided into several categories?
What is a frequency table?
100
The value that comes up the most in a data set
What is the mode?
100
A survey showed that 36 male preferred dogs, 8 preferred cats and 2 had no preference. The same survey showed 22 female preferred dogs, 26 preferred cats, and 6 had no preference. Construct a frequency table.
What is (show your table)?
100
The measurement of how strong the linear relationship of variables is.
What is correlation?
100
What b stands for in the formula y=mx+b.
What is y-intercept?
200
A variable that places an individual into once of several groups or categories
What is a categorical variable?
200
The median of the following numbers: 18, 23, 25, 38, 96, 182, 183
What is 38?
200
Construct of box plot manually for the following data. Show every step.
60, 45, 52, 90, 86, 77, 65, 92
What is (work must done) ?
200
TWhen above-average values of one tend to accompany above-average values of the other, and below-average values also tend to occur together.
What is positively associated?
200
What model would fit this model best? Explain.

What is a linear model because there is no specific pattern?
300
An individual value that falls outside the overall pattern
What is an outlier?
300
The five values that make up a five number summary
What are minimum, Q1, median, Q3, and maximum?
300
A survey showed that 36 male preferred dogs, 8 preferred cats and 2 had no preference. The same survey showed 22 female preferred dogs, 26 preferred cats, and 6 had no preference. Construct a column relative frequency table.
What is (work must done) ?
300
A box that uses five-data-summary values.
What is a box-plot?
300
a) Write an equation for the line of best fit (round
slope and intercept to the nearest hundredth).
b) Find the correlation coefficient.
c) Predict the score, to the nearest integer, on test y for a student who scored 87 on test x.
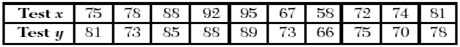
What are (do the work - you know)?
400
When the right side of the histogram extends much father than the left
What is right skewed?
400
The ______ is sensitive to outliers, but the _______ is not
What is mean, median?
400
Find the mean, median, mode, and IQR.
Number of Phones 0 1 2 3 4 5
Frequency 4 3 4 2 3 3
What are Mean = 2.3; Med = 2; Mode = 0 and 2; IQR = 3?
400
The value that controls the spread of a normal curve.
What is the standard deviation?
400
The table below, created in 1996, shows a history of transit fares from 1955 to 1995. On the accompanying grid, construct a scatter plot where the independent variable is years.
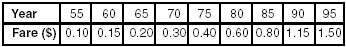
State the exponential regression equation with the coefficient and base rounded to the nearest thousandth.
Using this equation, determine the prediction that should have been made for the year 2016, to the nearest cent.
What are (do the work)?
500
A table that represents the frequency categorical variables as percentages based on the total, based on rows, and based on columns?
What are relative frequency, row relative frequency, and column relative frequency?
500
The Q3 of this number set: 22, 25, 27, 34, 40, 48, 49, 55, 59, 68, 88, 95, 152,
What is 78?
500
Twenty-one library visitors were asked how many books they took out every month. The results are recorded below.
2, 3, 5, 2, 4, 3, 5, 1, 4, 5, 6, 1, 1, 3, 2, 6, 7, 5, 1, 2, 4
Represent this data using a dot-plot and find out
what would be the typical number of books taken out? Explain why.
What is (show dot plot); mean = 3.4; med = 3; typical value would be median because there are more lower values?
500
Isabella ran a linear regression test and had a correlation coefficient of -0.9. Brianny ran another linear regression test and had a correlation coefficient of 0.70. Whose data set had a stronger association? Explain.
What is Isabella's data set because the value is closer to -1 than 0.70 is closer to 1? (The closer the data set is to -1 or 1, the stronger the relationship of the data set is.)
500
The accompanying table shows the number of new cases reported by the Nassau and Suffolk County Police Crime Stoppers program for the years 2000 through 2002.
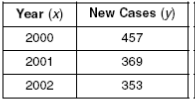
If represents the year 2000, and y represents the number of new cases, find the equation of best fit using a power regression, rounding all values to the nearest thousandth.
Using this equation, find the estimated number of new cases, to the nearest whole number, that should have been predicted for the year 2007.
What are (do the work - you can)?