Shape / Skewed
Range
Median
Mean
Quartiles
100
The direction this graph is skewed.
What is skewed right?
100
Define range:
What is the difference between the lowest value and the highest value of the data?
100
The median of this graph

What is 5?

100
The mean of this data set is...
5;10;7;8;6
What is 7.2?

100
The quartile that the blue arrow is pointing to.
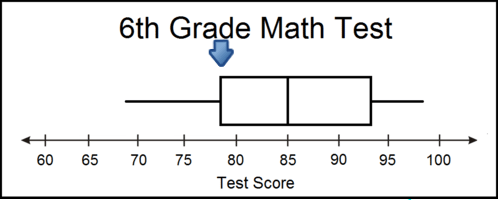
What is the first/lower quartile?

200
The direction that this graph is skewed.
What is skewed left?

200
The range of this data is

What is 45?

200
The middle of the two sections before and after the median
What is quartile 1 and 3?

200
The mean of this data set is...
6.2;8.5;5.3;6.9;3.8;4.6
What is 5.883?

200
Another name for the median.
What is Quartile 2 (Q2)?

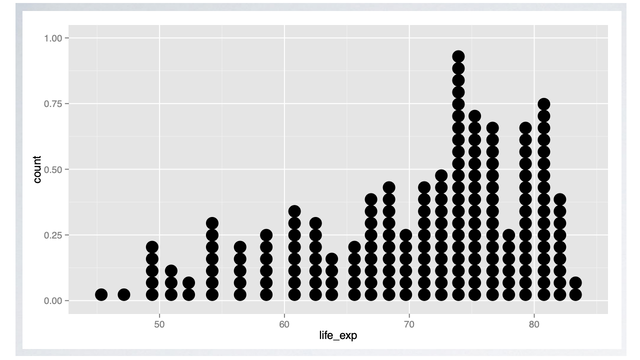
300
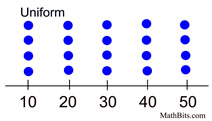
How the graph is distributed.

What is equally distributed?
300
The range of this graph is
What is 40?

300
The median of the graph
What is 3?

300
The mean of this line plot is...

What is 1.875?

300
The IQR (Interquartile Range) of this box-and-whisker plot.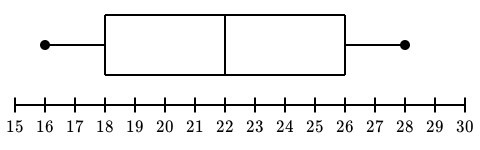
What is 8?
400
The height of the peak.

What is 300?

400
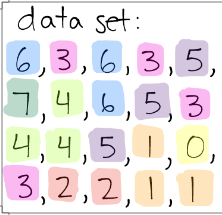
The range of this data set.
2;5;6;9;11;17;15
What is 15?

400
The median of the data set
9;3;6;4;7;5;3;1
What is 4.5?

400
Cam has the following scores on his math tests:
89;94;92;87;96;90
To get a 90% average math test score, he needs to score ? on his next test.
What is 82?

400
The IQR of this graph is

What is 9?

500
The number of gaps in this plot.
What is no gaps?

500
The range of this data set is
What is 7?
500
The difference of the medians of the tables (2nd from 1st table)
9;2;3;6;2;5;7
6;5;3;4;5;4
What is 0.5?

500
Robert has the following times on a 40-yard-dash:
4.1;4.0;4.2;4.3;4.1;4.2
To have an average time of 4.2 seconds, what does he need to run?
What is a 4.5?

500
The difference between the IQRs of these two box plots.
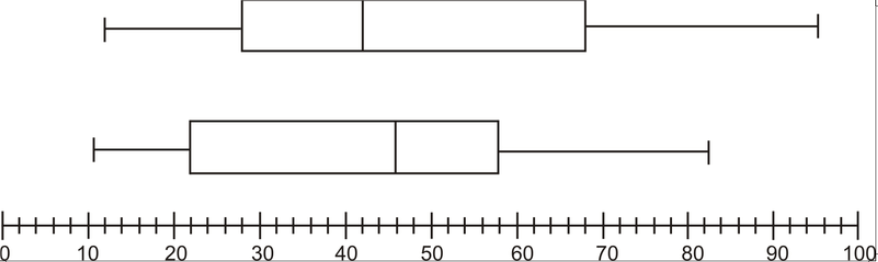
What is 4?