Vocabulary
Statistical Questions
Mean
Visual Representations
Median, Mode, Range
100
Identify the difference between a statistical question and a question that is not considered to be statistical.
What is a statistical question asks more than one person therefore leading to the data varying and a non statistical question asks only one person so the data does not vary.
100
What is the mean for the following data
8 8 8 8 8 8
8
100
Without doing any calculations, identify the mean of the data set below and explain why you know what it is.
14, 14, 14, 14, 14, 14
What is 14. The mean is 14 because all of the data points are 14 leaving zero variability.
100
Below are the number of pets different 6th grade students have. Create a dot plot from the given data.
1, 5, 6, 6, 7, 3, 9, 9, 2, 3, 1
What is appropriate dot plot.
100
Find the Q1 and Q3 from the given data set.
4, 2, 8, 14, 21, 13, 11, 10, 29
Q1=6
Q3=17.5
200
Create an example of a statistical question that is numerical.
Questions will vary.
200
What is the standard deviation for the following data
8 8 8 8 8 8
0
200
Calculate the mean of the data set below:
0, 0, 3, 3, 5, 7
What is 3
200
Determine the mode. 
What is 6.
200
Determine the IQR of the given data set:
0, 4, 6, 3, 4, 5, 5, 6, 9, 4, 4, 5, 5, 5
1
300
Identify how you would find the median.
What is put the numbers in order from least to greatest and keeping crossing off one number from each side until one number is left or until there are two numbers left in the middle and they are averaged together.
300
In the following statements which measure of center is being used.
Half of all surgeons practice more than 38 hours per week,
Median
300
Calculate the mean of the data set below:
17, 14, 16, 14, 11, 12
What is 14.
300
Below is a list of data representing the number of pairs of sneakers students in 6th grade own. Create a dot plot from the given data.
3, 6, 7, 5, 6, 6, 5, 4, 2, 1, 1, 1, 5, 6
What is an appropriate dot plot.
300
Determine the median from the given data set.
45, 12, 21, 33, 9, 21, 25, 31
What is 23.
400
Collin was explaining to Avery that in order to find the mean, she had to put the numbers in order from least to greatest and find the middle number. Explain if Collin is correct or not and explain why.
What is Collin is not correct. He is explaining how to find the median instead of the mean. To find the mean, Avery has to add all of the numbers together and divide by the total number of data points.
400
In the following statements which measure of center is being used.
On average it takes 37 minutes to perform a routine gallbladder surgery.
mean
400
Calculate the mean of the data below:
33, 48, 36, 45, 42, 42, 48
What is 42.
400
Determine the median, mode, and range from the following dot plot. 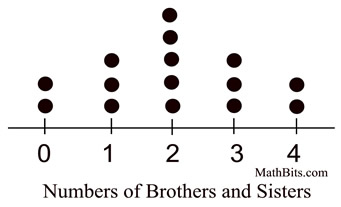
What is:
median: 2
mode: 2
range: 4
400
Determine the mode from the given data set.
105, 116, 101, 115, 113, 105, 101
What is 105 and 101.
500
What is the difference between skewed left, skewed right, and approximately symmetrical?
What is the way the data is displayed in a histogram. Skewed left means that there is "unusual" data that is less than the majority of the data. Skewed right means that there is "unusual" data greater than the majority of the data. Approximately symmetrical means that one side of the histogram is almost a mirror image of the right side of the histogram.
500
In the following statements which measure of center is being used.
More surgeons practice with three examining rooms, two nurse assistants and a half time laboratory technician than any other medical staffing patters.
Mode
500
Determine the mean: 370, 360, 350, 370, 350
What is 360.
500
Create a histogram from the data below.
What is an appropriate histogram.
500
Determine the median, mode, and range of the given numbers.
3, 4, 9, 7, 7
What is:
median: 7
mode: 7
range: 4