Dot Plot
Histogram
Box and Whisker
Distributions
Mean, Median, Mode, Range
100
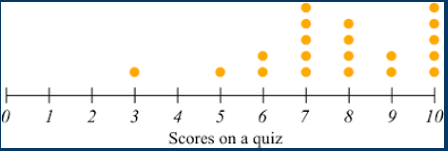
The dot plot shows the quiz scores of students is Ms. Tidwell's 1st period class. Based on this dot plot, how many students are in Ms. Tidwell's 1st period class?
Count the number of dots. There are 20 dots, so there are 20 students who took the quiz in her 1st period class.
100
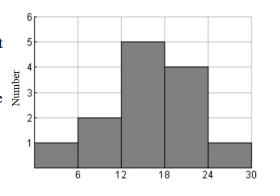
How many people have more than 18 pairs of shoes?
4+1 = 5
100
What is the Q1 of the data set?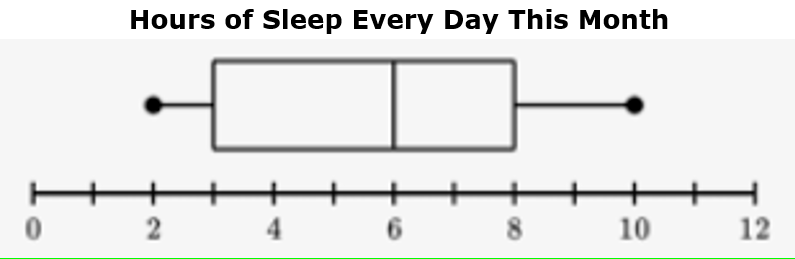
3 hours
100
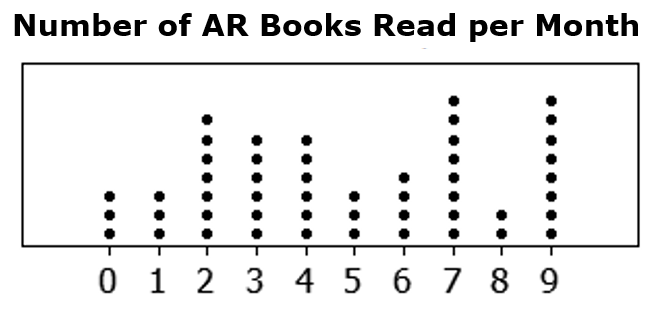
What is the Distribution of the Data set?
Normal, Skewed, Bimodal, or Uniform?
Bimodal
100
The data set below shows the number of free throws made by the high school basketball team during last season’s games.
8, 12, 5, 8, 4, 13, 9, 8, 5, 6, 8
What is the most frequent number (MODE) of free throws made in the basketball team’s last season games?
Mode = 8
Most frequent number in the data set.
200
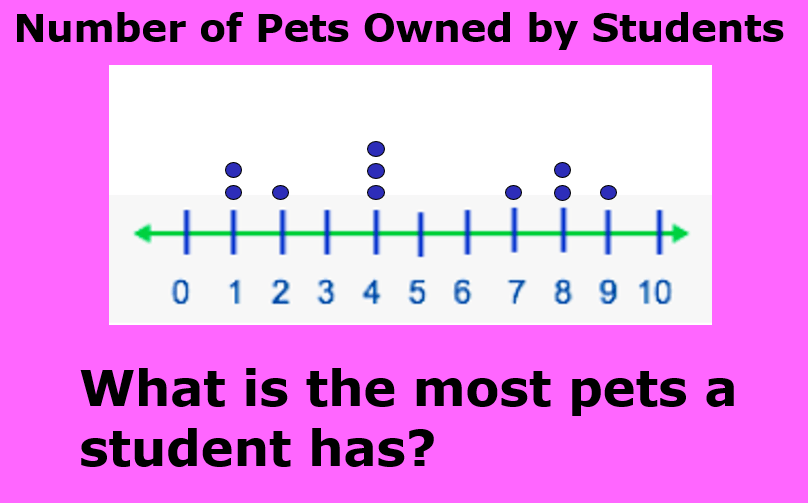
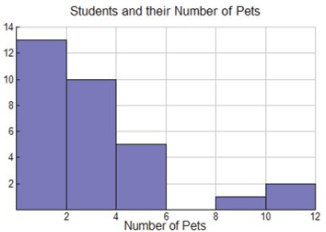
9 pets
200
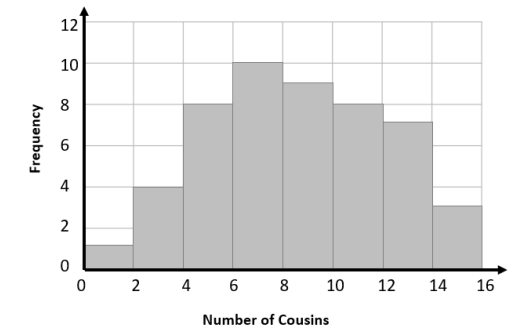
How many students have between 4-8 cousins?
18 students
200
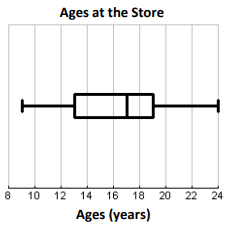
What percent of people are 13 or older?
75%
Each segment of the box and whisker plot is 25%
200
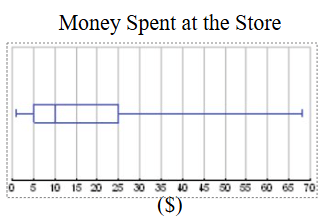
Are there any Outliers? If so, where?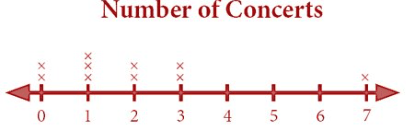
Yes, 7
200
Lisa surveyed her friends to see how many minutes they had to read yesterday to finish their book. The results are in this list:
35, 20, 15, 20, 45, 24
What is the average of the data?
The mean is 26.5
300
How many students scored a 90% or higher?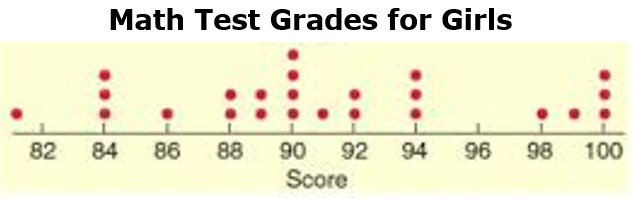
15 students
300
How many students had at least 12 pets?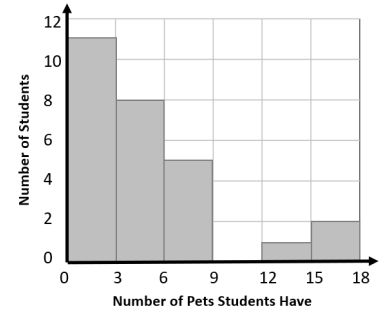
1+2 = 3 students
300
What is the 5 number summary?
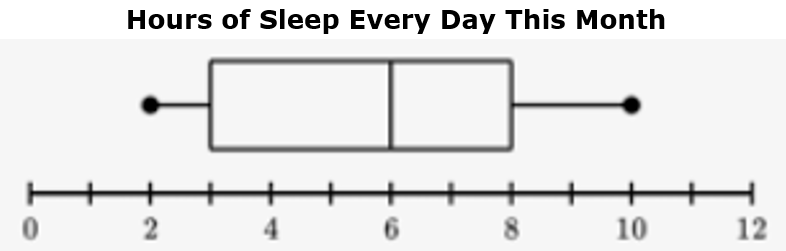
2~3~6~8~10
300
What is the Distribution of the Data set?
Normal, Skewed, Bimodal, or Uniform?
Skewed
300
Find the median of this data set:
13, 2, 4, 8, 4, 1, 16, 12, 4, 8
Median: 6
400
What is the MODE of the data set?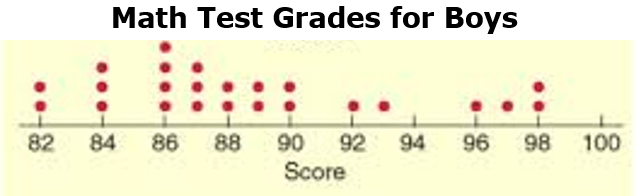
86%
400
In what interval would the number 3 belong?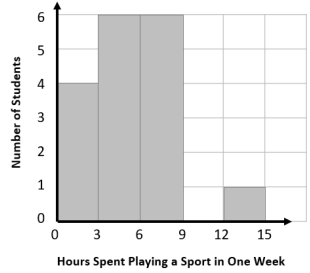
3-6
400
What is the IQR?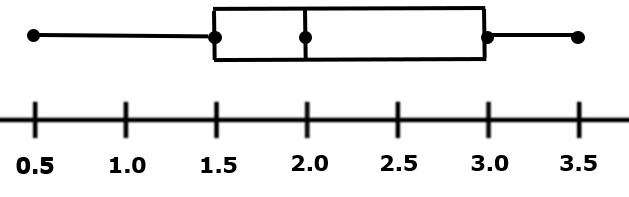
IQR = 3-1.5
IQR = 1.5
400
 Are there any gaps? If so, where?
Yes, 6-8
400
What would be the better measure of center (mean or median) to use to summarize the data below:
4, 3, 5, 6, 2, 3, 27
MEDIAN!
Outliers mess with data points. 27 is an outlier, so the mean would not accurately reflect most of the data.
500
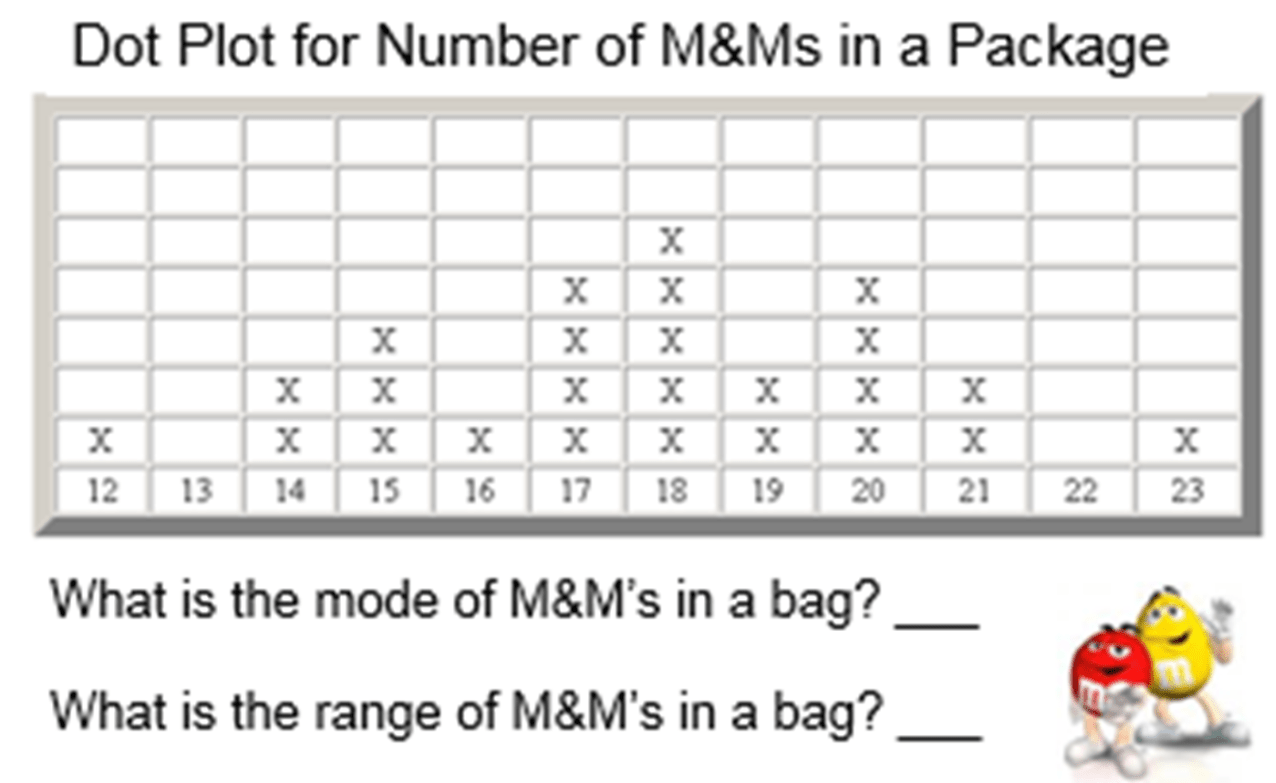
Mode = 18
Range = 11
500
How many people spent between $10-$25 on snacks?
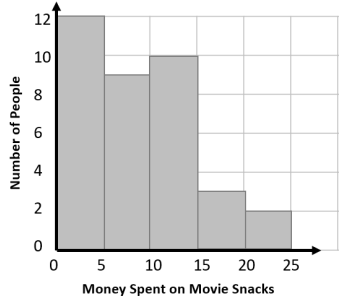
10+3+2 = 15 people
500
True or False: Tamika's minimum is lower than Cari's minimum.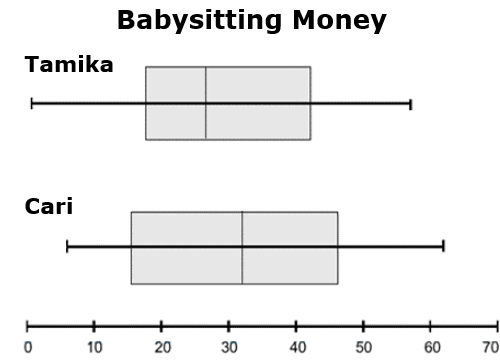
True
500
Predict the shape of a histogram representing the data set:
Number of languages spoken by students.
(Normal, Skewed, Bimodal, Uniform?)
Skewed
500
Find the range and interquartile range (IQR) of the following data set:
17, 18, 13, 15, 12, 11, 35, 18, 14
2. Which measures spread best represent the data in #1? Explain
1. mean = 17; median = 15; range = 24; IQR = 5.5
2. Answers may vary. Since the outlier (35) affects the mean and range, the median and IQR probably best represent the data