Data Measures
Mean,Median, Mode, Range
Histograms
Dot Plots
Shape, Center, Spread
Biased/ Unbiased/ sample/ Population
100
A teacher asked 20 students how many books they read last summer. The dot plot displays the data.
What is the MODE number of books read?

1
100
What is the range for the numbers below?
10, 30, 12, 45, 36, 25, 37, 40, 42, 44
35
100
The following histogram shows the ages of library visitors.
About how many people are between 60 and 80 years old?
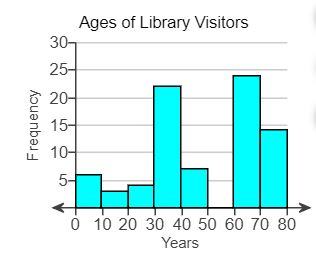
between 37 and 39 ish
100
The following dot plot shows the number of hours 15 people exercised per week.
What is the greatest number of hours someone exercised?
9
100
What is another name for spread?
Range!
100
A person wants to find which hamburger tastes the best. The person goes to McDonald's to get this answer. Is this biased or unbiased?
Biased
200
A teacher asked 20 students how many books they read last summer. The dot plot displays the data.
What is the RANGE of the number of books read?
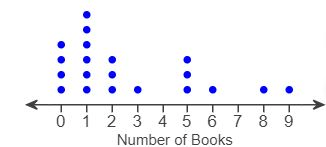
9
200
What is the mode?
10, 30, 12, 45, 36, 25, 37, 40, 42, 44
None
200
The following histogram shows the ages of library visitors.
About how many people are less than 30?
About 12-14
200
The following dot plot shows the number of hours 15 people exercised per week.
Most people exercised _______ hours.

1
200
How do you find the center of the graph?
Find the greatest amount!
200
A survey is conducted at the local shopping mall about household products used on a daily basis? Is this biased or unbiased?
Unbiased
300
A teacher asked 20 students how many books they read last summer. The dot plot displays the data.
What is the MEDIAN number of books read?

1.5
300
What is the median?
10, 30, 12, 45, 36, 25, 37, 40, 42, 44
36.5
300
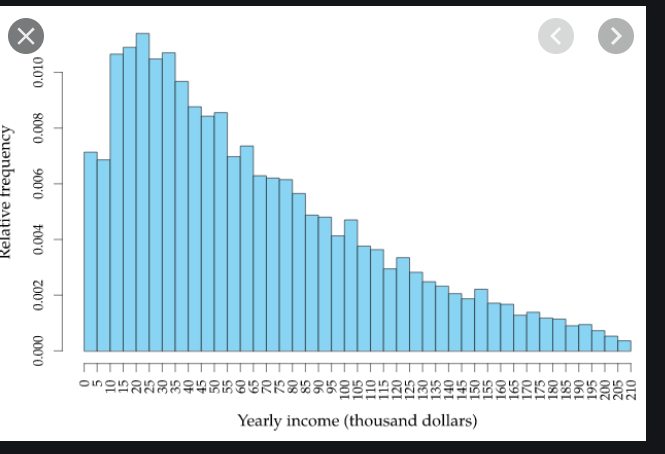
The follow shows the distances people will drive to work.
About how many people drive more than 30 KM to work?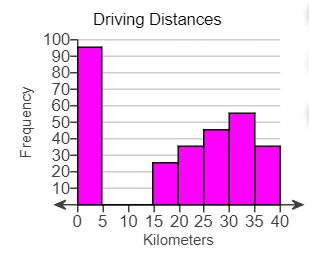
About 90
300
The following dot plot shows the number of hours 15 people exercised per week.
How many people exercised for 6 or more hours
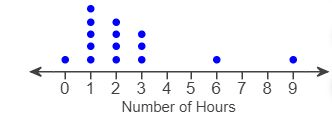
2
300
What are the two options for the shape of a graph?
On one side or U-Shaped
300
Every 40th person who enters the school is asked to name their favorite sports. Is this survey unbiased or biased?
Unbiased
400
A teacher asked 20 students how many books they read last summer. The dot plot displays the data.
What percent of students read 1 book?

30%
400
What is the mean?
10, 30, 12, 45, 36, 25, 37, 40, 42, 44
32
400
The follow shows the distances people will drive to work.
How many people live very close to work?
About 95 (0-5km is close!)
400
What percent of people read for 2 hours or less?

66%
400
What is the shape of this graph?
On One side
400
Sample: The number of pets in each US household.
What is the population?
The number of pets in the world's.
500
A teacher asked 20 students how many books they read last summer. The dot plot displays the data.
What is the MEAN number of books read?
2.65/2.7
500
What number if an outlier?
4, 9, 2, 6, 1, 34
34
500
The follow shows the distances people will drive to work.
About how many total people were surveyed?
280-300
500
How many people exercised less than 3 hours?
10
500
What is the center of the graph?
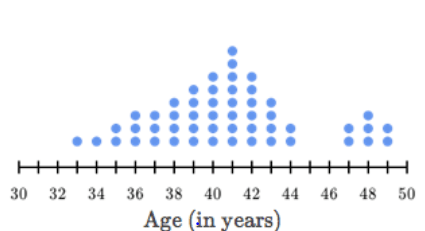
41
500
Population: The speed of cars in Manhattan
Sample:?
Multiple Answers