What Graph is that?
Probability
Statistics Related
100

What is a bar chart?
100
What is probability
what is a number that reflects the chance or likelihood that a particular event will occur.
100
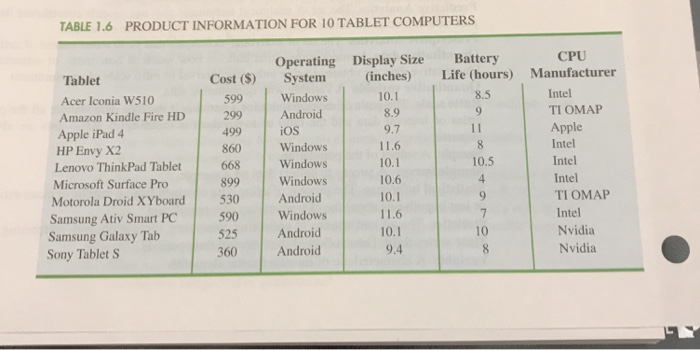 . How many elements are in this data set?
What is 10?
200

What is a histogram?
200
What is the union of sets A and B?
what is AuB
200
In general, which of the following best describes the shape of this histogram? Skewed left, skewed right, or symmetrical?
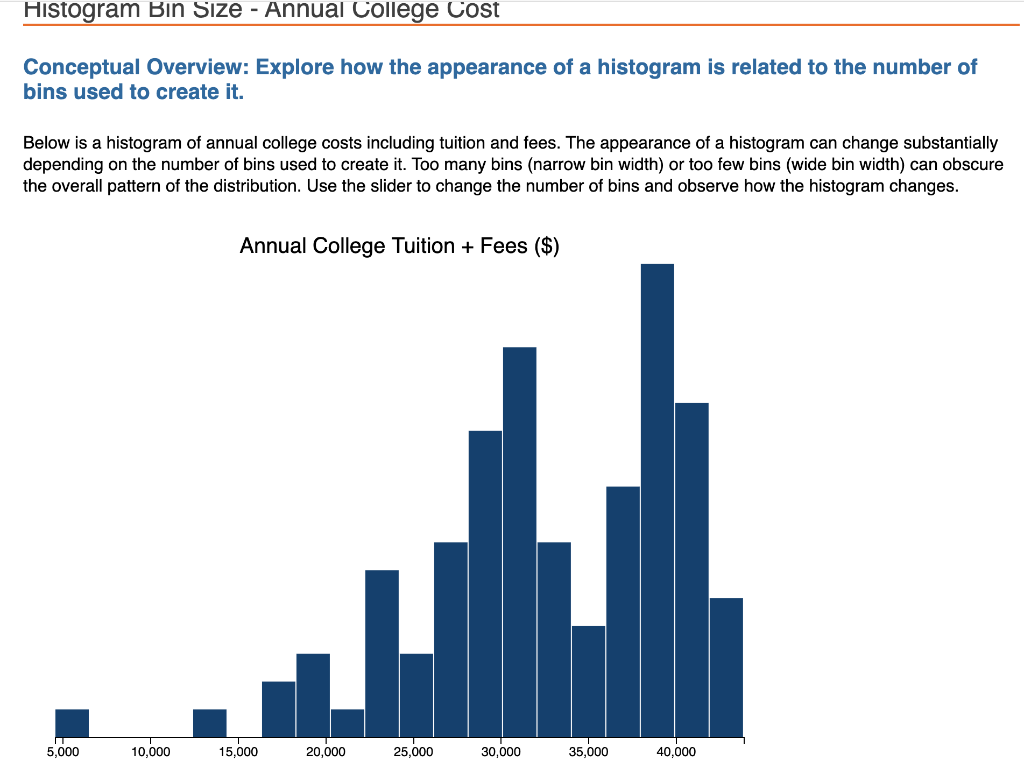
What is skewed left?
300

What is a scatterplot?
300
An event in which the first outcome doesn't effect the 2nd outcome ?
what is an independent event
300
Goals scored in a soccer game is an example of:
a categorical variable?
a quantitative variable?
neither a quantitative nor categorical variable?
or either a quantitative or categorical variable.
What is a quantitative variable?
400

What is a pie chart?
400
The probability of drawing an ace from a deck of cards?
what is 4/52
400
In a questionnaire, respondents are asked to mark their gender as male or female. The scale of measurement for gender is _____ scale.
A. Ratio
B. Interval
C. Nominal
D. Ordinal
What is nominal?
500
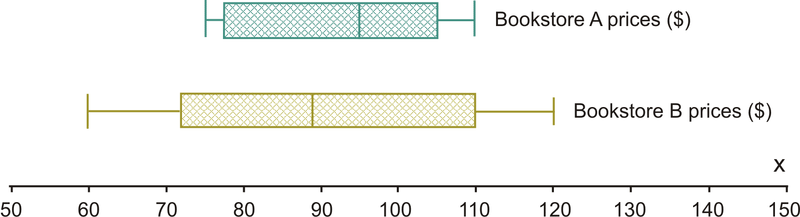
What is a box and whisker plot?
500
If you have a collection of 24 sharpies, 8 of them are red 5 are black, 9 are blue, and two are yellow. Find p (red)
what is 11/24
500
What is the set of measurements collected for a particular element called?
A. observation
B. variable
C. sample
D. population
What is observation?