Vocabulary
Mean and range
Mode and Median
graphs and outlier
Mutiple choice
100
define the word range
the range refers the difference between the highest value and the lowest value and you subtract it and get your answer
100
find the range of:
109, 123, 145, 894, 147
785
100
find the mode
1, 2, 3, 4, 5, 6, 6, 6, 6, 7, 8
6
100
what is the outlier
123, 124, 125, 126, 456
What is 456
100
find the range: 789, 1256, 1, 0, 567,
a. 1255 b. 1256 c. 1246 d. 789
b. 1256
200
define the word mean
the mean is data that is called the average of that set, to find it you have to find the sum of the data values in a set and divide it by how many numbers there was
200
find the mean of these numbers:
45, 67, 89, 23, 12
47.2
200
find the median: 1, 3, 5, 5, 7, 9, 10
5
200
if there was 16 paris running shoes and 13 paris of basketball shoes and 5 pairs of golf shoes and 25 pairs of tennis shoes. if there was a bar graph which one would of been the highest?
tennis shoes
200
if 100 people like mc. donalds and 70 people like burger king then what is the mean?
a. 87 b. 86.c. 84 d. 85
d. 85
300
define the word median
its a data set thats the middle number when the data are lited from least to greatest
300
find the mean:
12, 13, 14, 15, 16, 17, 147
33.4
300
find the mode : 67, 891, 819, 345, 819
819
300
1146 people love chocolate icecream 1145 people love vanilla and 89 people love strawberry and 1143 love rocky road icecream. what is the outlier of the icecream?
strawberry(89)
300
find the median: 234, 109, 245, 89, 75, 134, 21, 54, 13
a. 75 b. 109. c. 89 d. 13
c.89
400
define the word mode
the mode is a data set that occurs the most.
400
Denika has 149 pairs of socks and Cintia has 890 pairs of socks and Niema has 123 of socks and terrell has 147 pairs of socks find the range
767
400
45, 6889, 6889, 6889, 12
6889
400
what is the outlier?
768, 234, 243, 214, or 241
768
400
find the mode:
543, 345, 453, 354, 354, 354, 123, 123, 123
a. 123 b. 354 c. both 123 354
c.354, and 123
500
define the word stem- and leaf diagram
its a graph that shows the shape of the data according to the datas place values
500
FIND THE MEAN: 1234, 1570, 784, 36, 9756
2676
500
8769, 6543, 789, 12, 957
5414
500
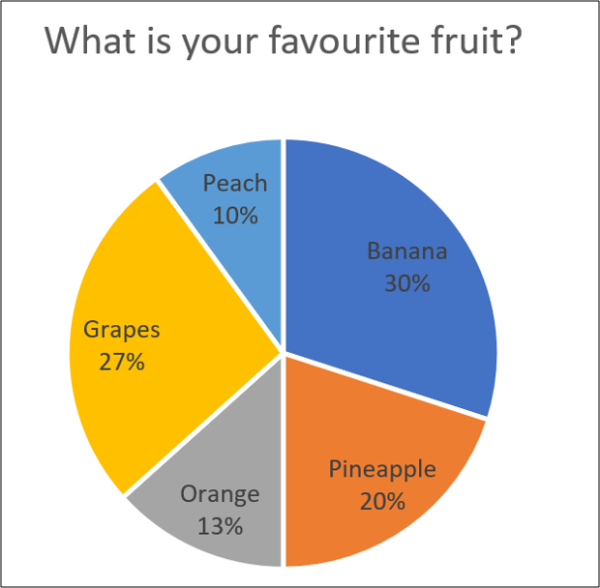
What percentage of people liked grapes and bananas?

57%
500
If C = 59(F – 32), find C when F = 212
100