Week 1 - Intro
Week 2 - Data and Probability
Week 3- Probability
Week 4 Inferential Stats
Week 5- Time Series
100
The midpoint of the values after they have been ordered from the minimum to the maximum values.
What is the Median?
100
Is used to determine the probability of an event occurring by subtracting the probability of the event not occurring from 1.
What is the complement rule?
100
The likelihood (Probability) of a particular event happening that is assigned by an individual based on whatever information is available.
What is subjective probability?
100
Distribution is characterized by the number of times an event happens during some interval or continuum.
What is the Poisson Probability Distribution?
100
The smoothed long-term direction of a time series.
What is secular trend?
200
A graph that shows qualitative classes on the horizontal axis and the class frequencies on the vertical axis. The class frequencies are proportional to the heights of the bars.
What is a bar chart?
200
Is a process that leads to the occurrence of one and only one of several possible results.
What is an experiment?
200
Is any arrangement of r objects selected from n possible objects. The order of arrangement is important.
What is permutation?
200
1) An outcome on each trial of an experiment is classified into one of two mutually exclusive categories—a success or a failure. 2)The probability of success and failure changes from trial to trial. 3) The trials are not independent, meaning that the outcome of one trial affects the outcome of any other trial. (Sampling is without replacement).
What is hypergeometric distribution?
200
The rise and fall of a time series over periods longer than 1 year.
What is cyclical variation?
300
The value of the observation that appears most frequently.
What is the mode?
300
Is the collection of one or more outcomes of an experiment.
What is an event?
300
Is the number of ways to choose r objects from a group of n objects without regard to order.
What is a combination?
300
The simplest distribution for a continuous random variable. It is rectangular in shape and is defined by minimum (a) and maximum (b) values.
What is a uniform probability distribution?
300
Patterns of change in a time series within a year. These patterns tend to repeat themselves each year.
What is seasonal variation?
400
A measurable characteristic of a sample.
What is a statistic?
400
A statistical technique to organize and present a set of data. Each numerical value is divided into two parts. The leading digit(s) becomes the stem and the trailing digit the leaf. The stems are located along the vertical axis and the leaf values are stacked against each other along the horizontal axis.
What is a Stem-and-leaf display?
400
Is used to find the joint probability that two events will occur when they are not independent.
What is the General Rule of Multiplication?
400
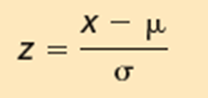
- Is a normal distribution with a mean of 0 and a standard deviation of 1. 2) Is also called the z distribution. 3)A z-value is the signed distance between a selected value, designated x, and the population mean, µ divided by the population standard deviation, σ.
What is the Standard Normal Probability Distribution?
400
A collection of data recorded over a period of time (weekly, monthly, or quarterly), that can be used by management to compute forecasts as input to planning and decision making. It usually assumes past patterns will continue into the future.
What is Time Series?
500
A measurable characteristic of a population.
What is a Parameter?
500
There are four shapes commonly observed:
1.symmetric, 2.positively, 3.negatively, and 4. bi-modal.
What is skewness?
500
Calculates the joint probability of two events A and B that are independent.
What is the special rule of multiplication?
500
Determining a regression equation by minimizing the sum of the squares of the vertical distances between the actual Y values and the predicted values of Y.
What is Least Squares Principle?
500
Determining a regression equation by minimizing the sum of the squares of the vertical distances between the actual Y values and the predicted values of Y.
What is Least Squares Principle?