Distributions
Measures of Central Tendency
Outliers
Measures of Variation
Vocab
1
What type of distribution is the following histogram?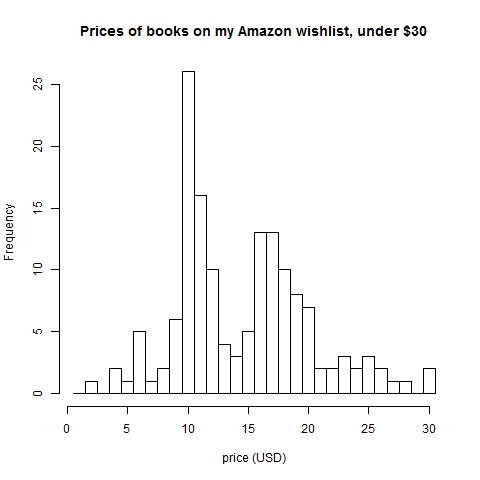
Bimodal
1
Find the mean, median, and mode of the following data set:
25, 19, 23, 40, 29, 31, 25
Mean: 27.4
Median: 25
Mode: 25
1
Identify the outlier in the following set of data:
100, 111, 121, 114, 198, 132, 104, 105, 109, 110, 110, 112, 131, 134, 123, 129, 128, 113, 119, 122
198
1
Find the range of the following data set.
45, 47, 90, 150, 32, 112, 23, 88, 90, 34, 68, 35, 39
127
1
What is an outlier?
A value that is extremely above or below the majority of the data.
2
What type of distribution would the following frequency table have?
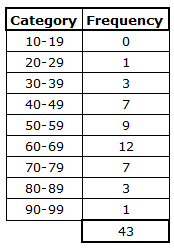
Mound-Shaped
2
Find the mean, median and mode of the following data set:
37, 10, 8, 9, 3, 31, 28, 24, 18, 10, 15, 10
Mean: 16.9
Median: 12.5
Mode: 10
2
If an outlier is greater than the majority of the data, the impact on the measures of central tendency would possibly be
increasing them
2
Find the variance of the following set of data. Round your answer to 1 decimal place.
32, 38, 39, 21, 31, 34, 35
30.7
2
The four types of distributions that we have covered are
Uniform, Mound-Shaped, Skewed, Bimodal
3
What type of distribution would the following relative frequency table have?

Uniform.
3
A software company pays their 8 employees the following hourly wages: 24, 29, 32, 31, 24, 24, 28, 31. Find the mean, median and mode of the data, then determine which measure would be the best and why?
Mean: 27.9
Median: 28.5
Mode: 24
Mean because there are no outliers.
3
Determine the effect the outlier in the following set of data has on the mean, median, and mode.
93, 97, 98, 98, 44, 92, 93
Mean and Median would decrease, the mode would not change.
3
Find the standard deviation of the following set of data. Round your answer to 1 decimal place.
32, 38, 39, 21, 31, 34, 35
5.5
3
The 3 measures of central tendency are
Mean, Median, Mode
4
In a 30 minutes session of reading, the students in the class read the following number of pages: 11, 28, 20, 23, 12, 14, 18, 14, 18, 15, 15, 12, 13, 14, 16, 25, 22, 23, 17, 29 . Using the intervals of 11-15, 16-20, 21-25 and 26-30, what type of distribution would represent the data.
Skewed.
4
Jonesville's basketball team had the following points per game averages: 10.1, 2.4, 24.3, 12.2, 8.9, 0.4, 7.4, 15.1, 9.8, 9.9. Find the mean, median, and mode for the team and determine which measure would be the best to use and why?
Mean: 10.05
Median: 9.85
Mode: No Mode
Best Measure: Median --> Outlier of 24.3
4
Determine the effect the outlier has on the mean, median, and mode of the data.
74, 78, 94, 64, 71, 64, 72, 64, 73, 77, 78
Mean and median would increase, the mode would not change.
4
Find the variance of the following data. Round your answer to 2 decimal places.
7.1, 2.3, 4.8, 9.2, 8.4, 9.3, 3.5, 8.6, 4.2, 5.1
5.97
4
The 3 measures of variation are
Range, Variance, Standard Deviation
5
A batter stuck out the following times during each week of the season: 4, 20, 8, 6, 11, 12, 21, 9, 13, 10, 5, 18, 7, 13, 16, 12, 8, 11, 17, 15, 21, 5. Using the intervals of 4-6, 7-9, 10-12, 13-15, 16-18, and 19-21, what type of distribution represents the data?
Uniform.
5
Mrs. Johnson decided to give out bonus points to all of her 100 students. She decided that the bottom 5 averages would get 10 points, the next 20 would get 5 points, and the rest would get 3 points. Find the mean, median, and mode of the data and determine the best measure to use and why?
Mean: 3.75
Median: 3
Mode: 3
Best Measure: Mode --> A group of data at 3 points
5
Outliers are important in statistics because
Outliers could identify errors in data analysis, influence the measures of center and variation, and show special circumstances.
5
Find the standard deviation of the following data. Round your answer to 2 decimal places.
7.1, 2.3, 4.8, 9.2, 8.4, 9.3, 3.5, 8.6, 4.2, 5.1
2.44
5
The difference between measures of central tendency and measures of variation is
The measures of central tendency find the middle while the measures of variation determine how spread out the data is.