Stem and Leaf Plots
Histograms
Bar Graphs
Mean, Med, Mode, Range
Mix
100
True or False: The stem can only be a single digit
False
100
true or false:
In a histogram the numerical information is always grouped in intervals
true
100
What is the most popular movie genre?
Romance
100
Vocabulary:
A measure of variability is a way of describing how ________ _____ the data is. It can can also be described as how much the data deviates from the center.
Spread out
100
What is the mode?
The value that appears most frequently in a data set
200
What place value does the LEAF in Stem and Leaf plots represent?
Ones Place Value
200
How does a histogram look different than a bar graph?
The bars touch in a histogram
200
How many people like comedy?
4
200
Calculate the mean of the data set:
33, 38, 35.5, 39.25, 31.75
35.5
200
How many days of snow were there in January and February?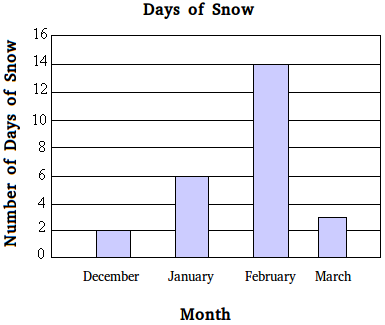
20
300
What is the MODE of the stem and leaf plot below: 
35 and 41
300
How many people on this graph are 40 to 60 years old?
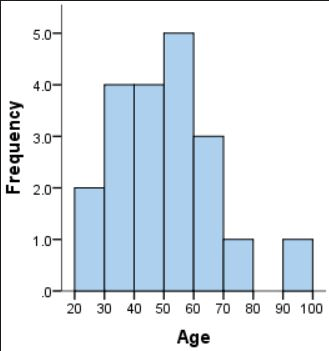
9 people
300
How many more people liked Romance over drama?
5
300
Calculate the range and mode of the data set:
625, 625, 619, 619, 677, 638, 659
Range - 58
Mode - 619 & 615
300
A basketball player scored the following points in 7 games:
Game 1: 18 points
Game 2: 24 points
Game 3: 15 points
Game 4: 27 points
Game 5: 21 points
Game 6: 30 points
Game 7: 19 points
What is the mean number of points the player scored per game?
22 points per game
400
What is the RANGE of the stem and leaf plot below:
48
400
Which age group has the most people with M&M as their favorite candy?
16-20
400
True or false. A bar graph can be used for numerical and categorical data.
True
400
Calculate the mean, range, median of the data set:
6.5, 7.6, 9.1, 2.4, 8.8
Range - 6.7
Mean - 6.88
Median - 7.6
400
What is the youngest age and the oldest age represented in the diagram?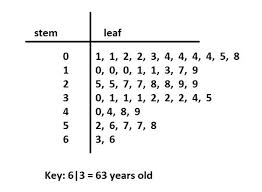
1 and 66
500
What is the MEDIAN of the stem and leaf plot below:
35
500
How many total trees were measured?
31
500
What is the mode?
4
500
What is the mean and median?
28, 36, 44, 59, 66, 71, 108
Median 59
Mean 58.86
500
What is the median of the following data set?
32, 6, 21, 10, 8, 11, 12, 36, 17, 16, 15, 18, 40, 24, 21, 23, 24, 24, 29, 16, 32, 31, 10, 30, 35, 32, 18, 39, 12, 20
21