Measure of Centre and Spread
Contingency tables and bar charts
Box, dot, stem and leaf plots
Scatterplots & Correlation
Random
100
What is the mode of the following set of data?
8, 1, 3, 8, 2, 4, 0, 9, 11, 3, 4, 5, 3, 7
3
100
How many total people were surveyed?
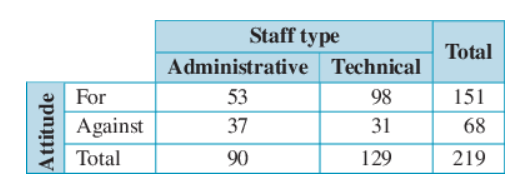
219
100
This parallel dot plot shows the scores of competitors across two days. How many people were surveyed?
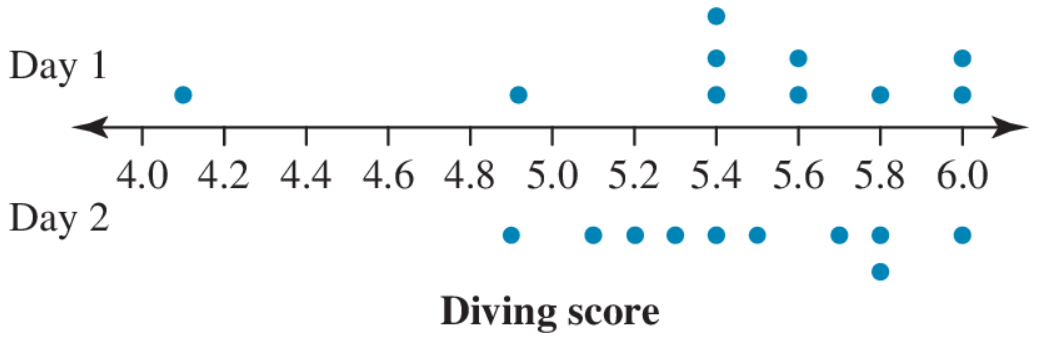
10
100
Is this relationship positive or negative?
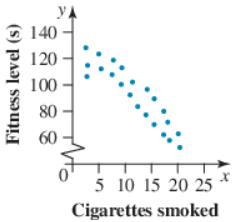
Negative
100
Which of the following would be an appropriate EV for the RV height?
A: Weight
B: Number of siblings
C: Time spent exercising
D: Age
D: Age
200
What is the range of the following set of data?
3, 7, 15, 11, 17, 22, 5, 8, 7, 21, 13, 1
21
200
How many technical staff were for the upgrade?

98
200
What is wrong with this chart?
The key is missing
200
What is the RV and what is the EV?

EV: Cigarettes Smoked
RV: Fitness level (s)
200
What is an appropriate r value estimation for this scatterplot?
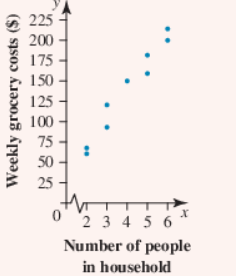
Between 0.8 and 1 (not including 1)
300
What is the median of the following set of data?
3, 7, 15, 11, 17, 22, 5, 8, 7, 21, 13, 1
9.5
300
What percentage of the administrative staff were against the upgrade?

41.1%
300
What is the median of each area? (approx)
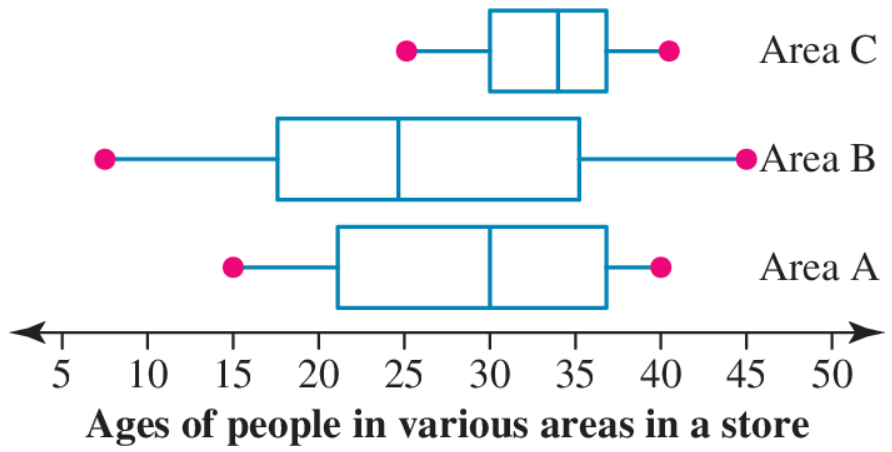
A: 30
B: 24
C:34
300
What are the four things we look for to describe the correlation between two variables in a scatter plot?
Direction (Pos/neg)
Outliers
Form (Linear/Non-linear)
Strength (r value)
300
DAILY DOUBLE! THIS QUESTION IS WORTH DOUBLE! (600).
What piece of data must be added to make the mean 18 instead of 17?
5, 18, 29, 11, 15, 19, 22, 30, 13, 8
28
400
What is the IQR of the following set of data?
8, 1, 3, 8, 2, 4, 0, 9, 11, 3, 4, 5, 3, 7
5
400
Approximately what percentage of adults preferred the main meal as their favourite?
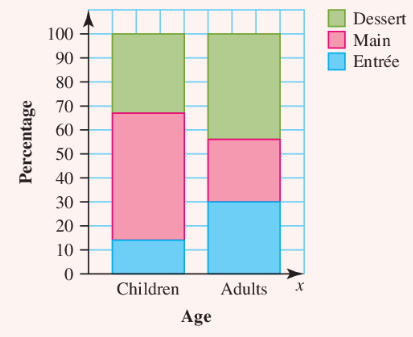
~26%
400
Describe the shape of all 3 box plots. Mentioning any outliers.
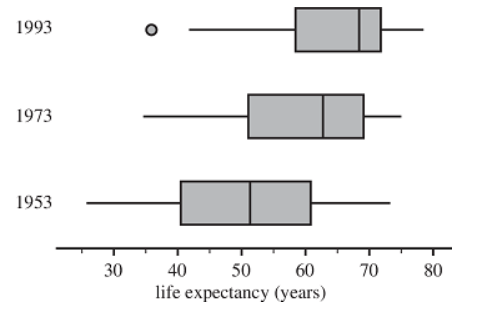
1993: Negatively skewed with an outlier
1973: Negatively skewed
1953: Symmetrical
400
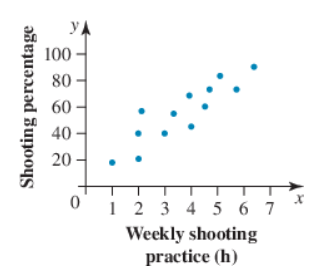
Which piece of data isn't shown on the scatterplot?
(3.5, 20)
400
Describe the correlation of the data. (four criteria required).
Direction: Positive
Form: Linear
No Outliers
Strength: ~0.91
500
What is the standard deviation of the following set of data? (2 decimal places)
3, 7, 15, 11, 17, 22, 5, 8, 7, 21, 13, 1
6.86
500
Of the 300 people surveyed (150 below 40 and 150 40 or above), they had a choice of which area of finances they wish to focus on as shown in the bar chart. Approximately how many people aged below 40 chose mortgage as their focus area?

~68 people
500
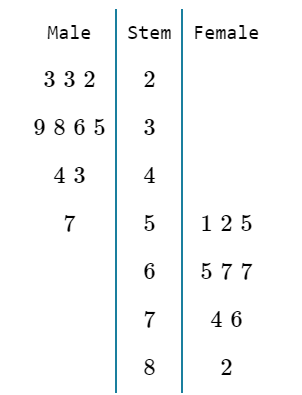
Calculate the mean for males.
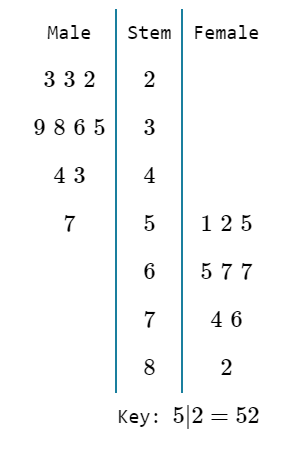
36
500
Calculate the coefficient of determination from the following set of data.
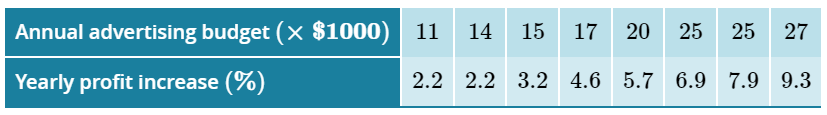
0.96
500
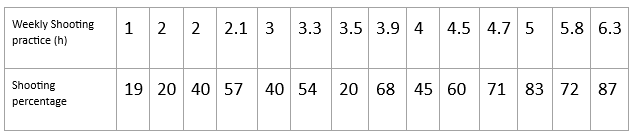
Explain if you can accurately use Pearson's correlation coefficient from this scatterplot?

You should not use Pearson's correlation coefficient to make judgements about the data in this scatterplot as it may give misleading information. The reason for this is because the data is not linear and it includes an outlier, both of which affect how accurate the r value is.